Starting GPlates and the user interface
Starting GPlates
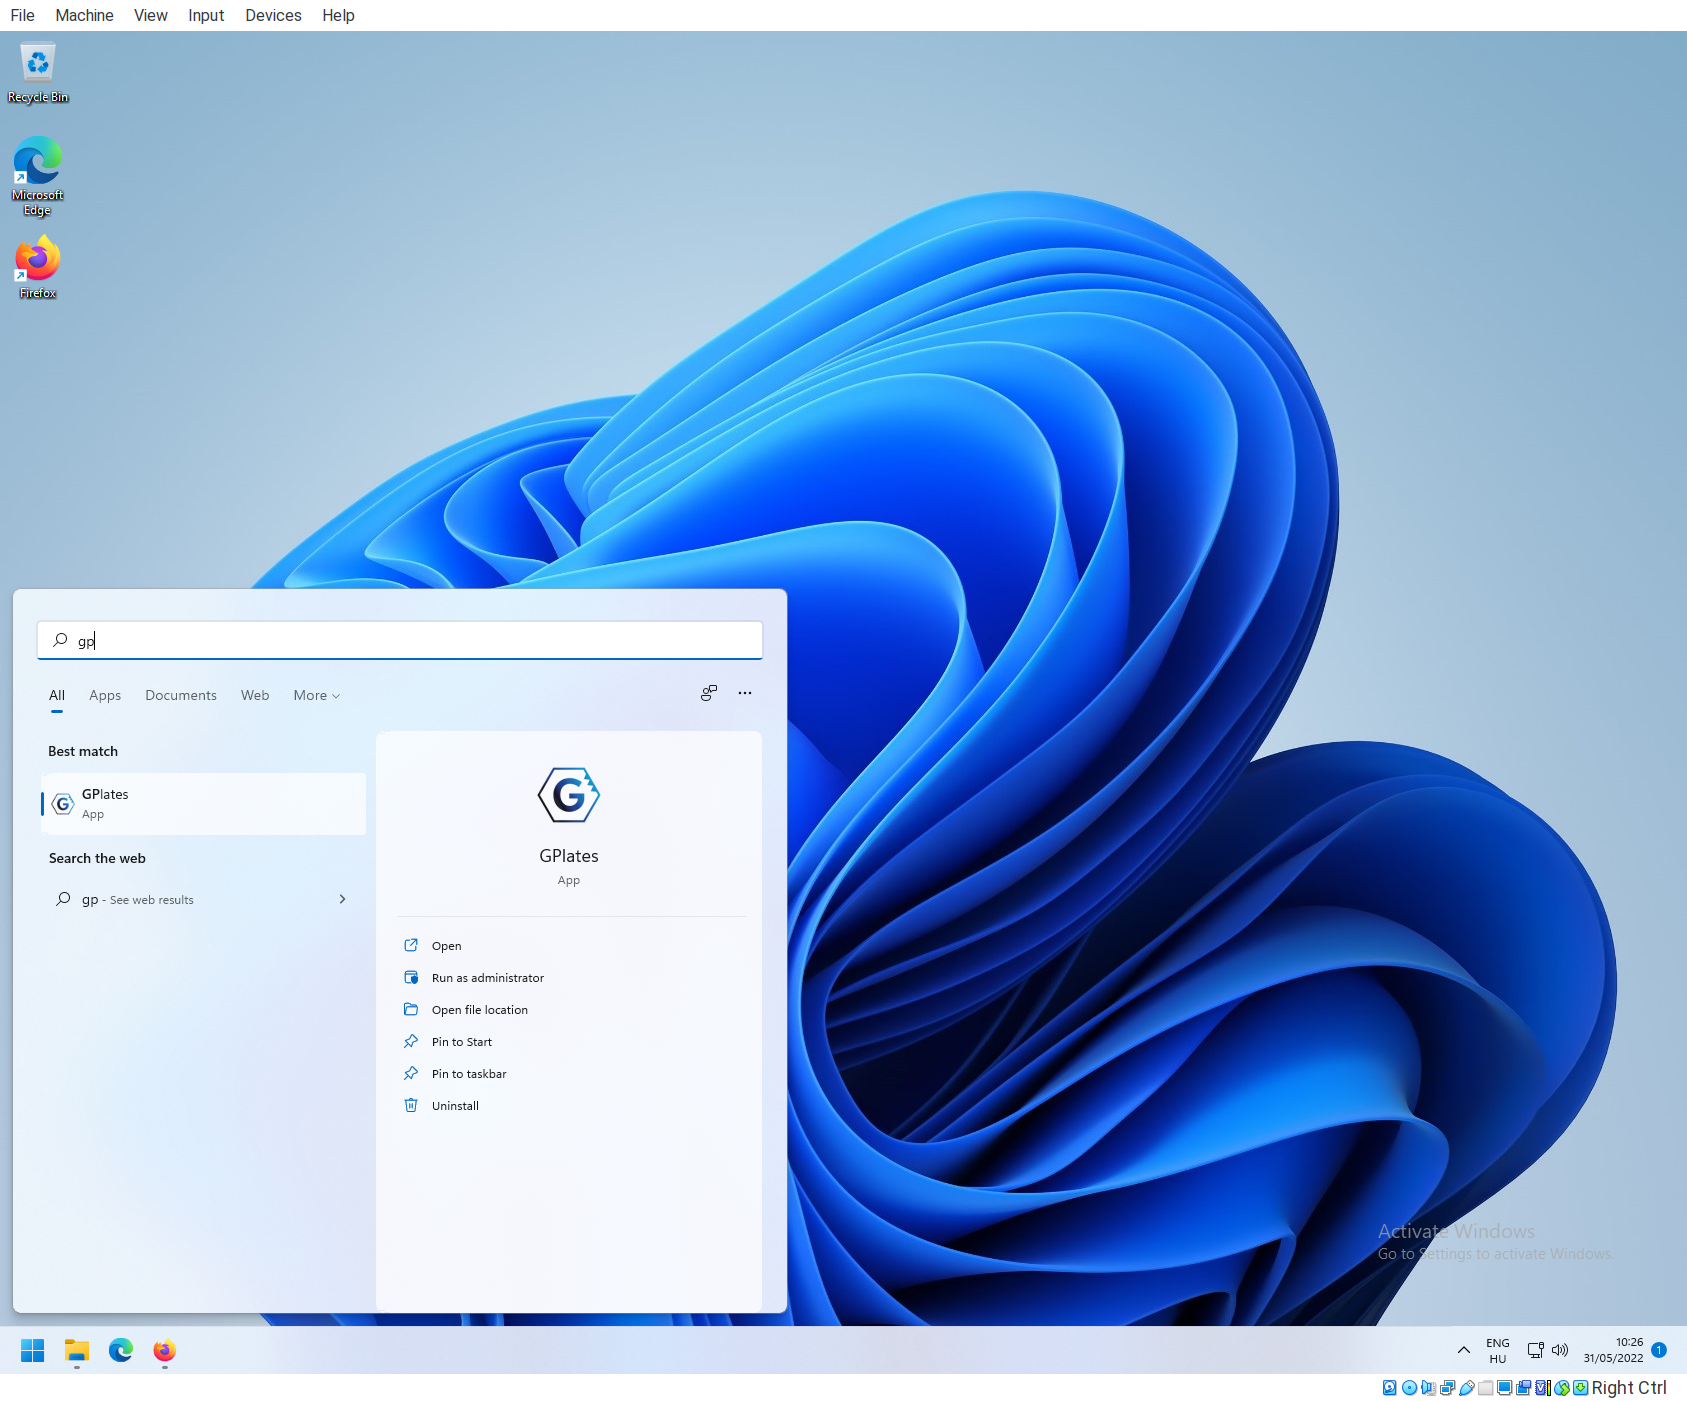
If you have followed instructions before, you should be able to find GPlates in the start menu. The simplest way to start the application is to either click on the start menu button on the taskbar, or hit the WIN/SUPER key and start typing in the name of the application: gplates. You will probably not even have to type in the entire name, and windows will find the program. All you have to do is hit RETURN/ENTER, and GPlates will start.
User Interface
By default, two windows are opened a log window and the main window of GPlates.
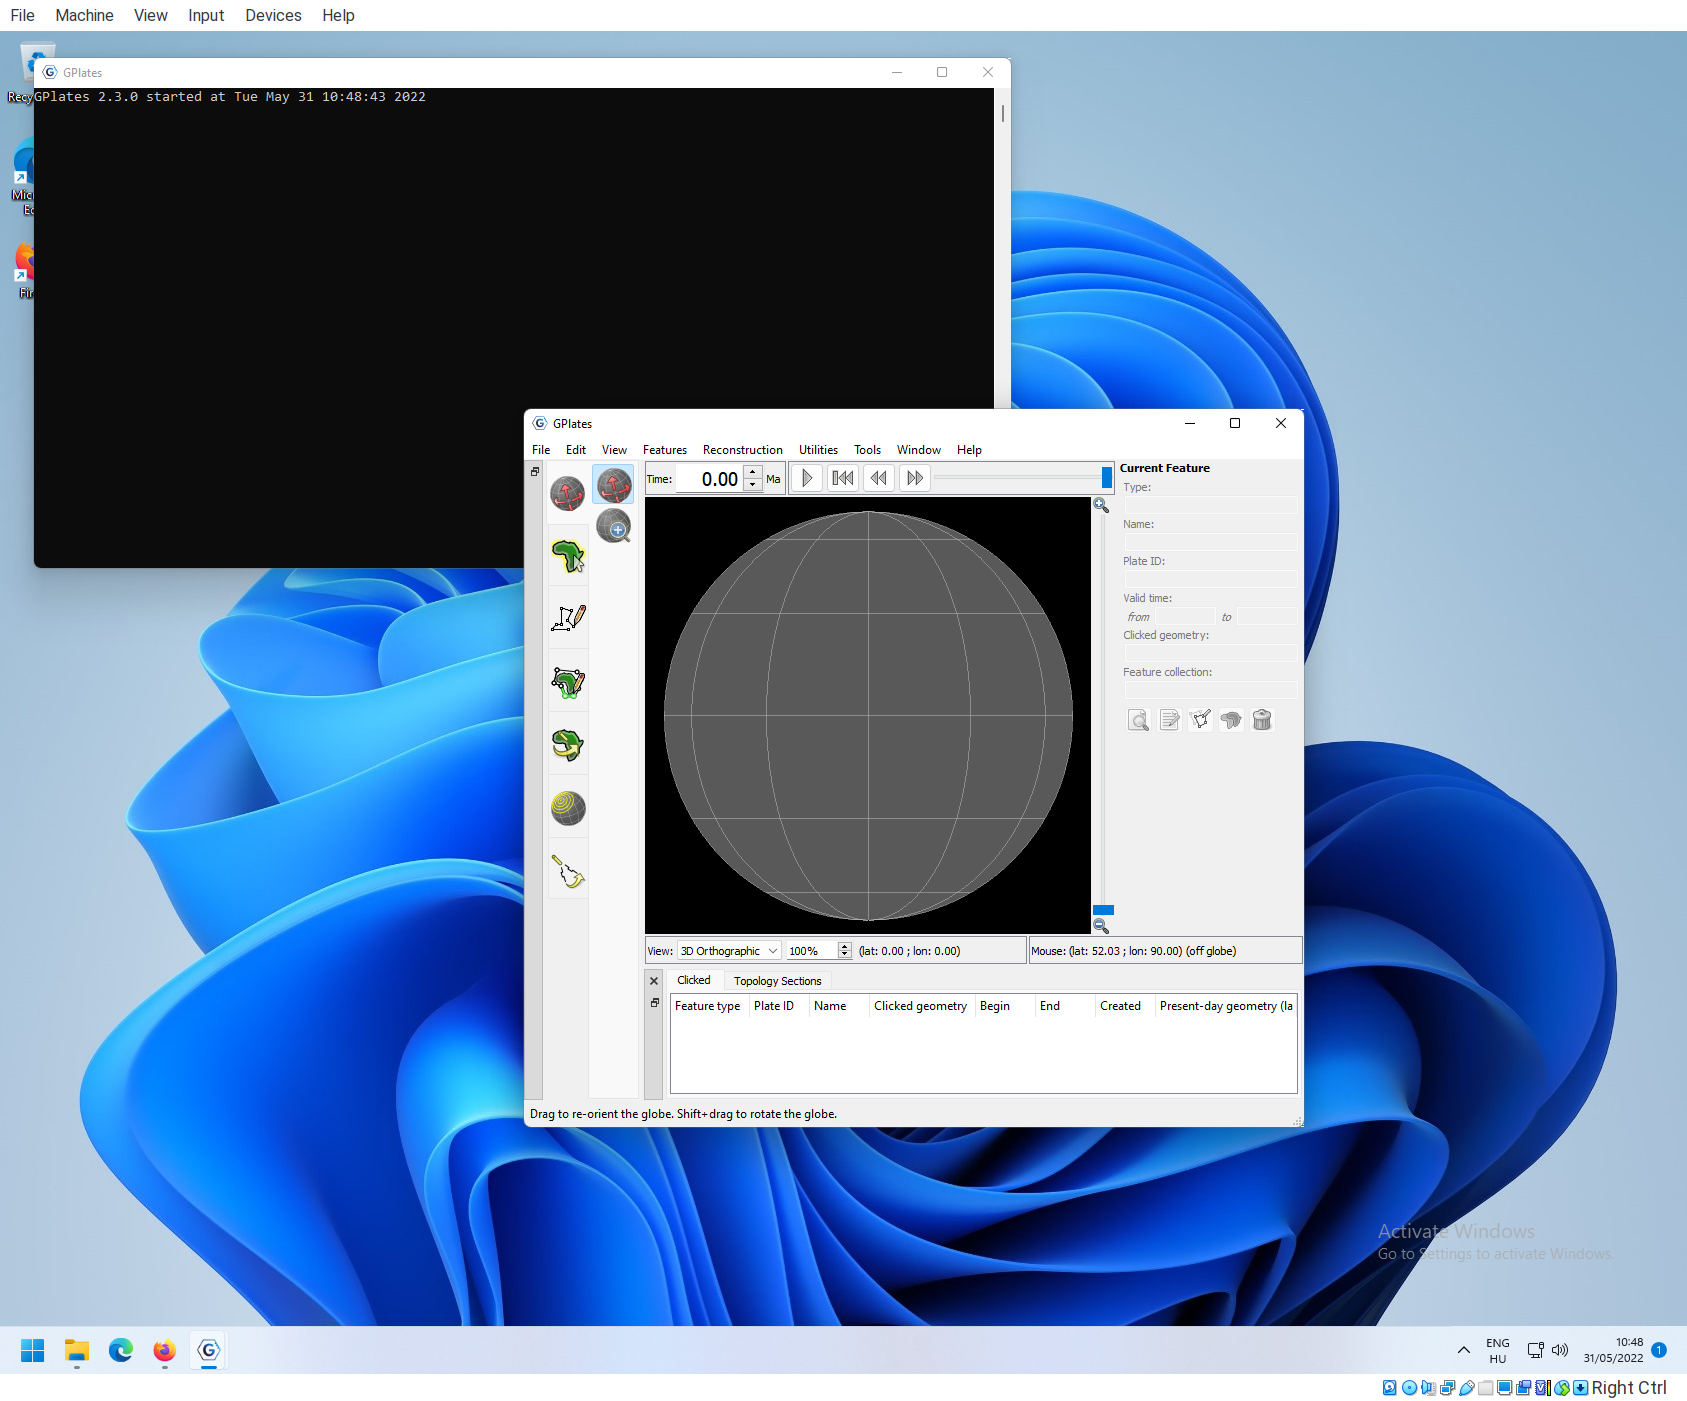
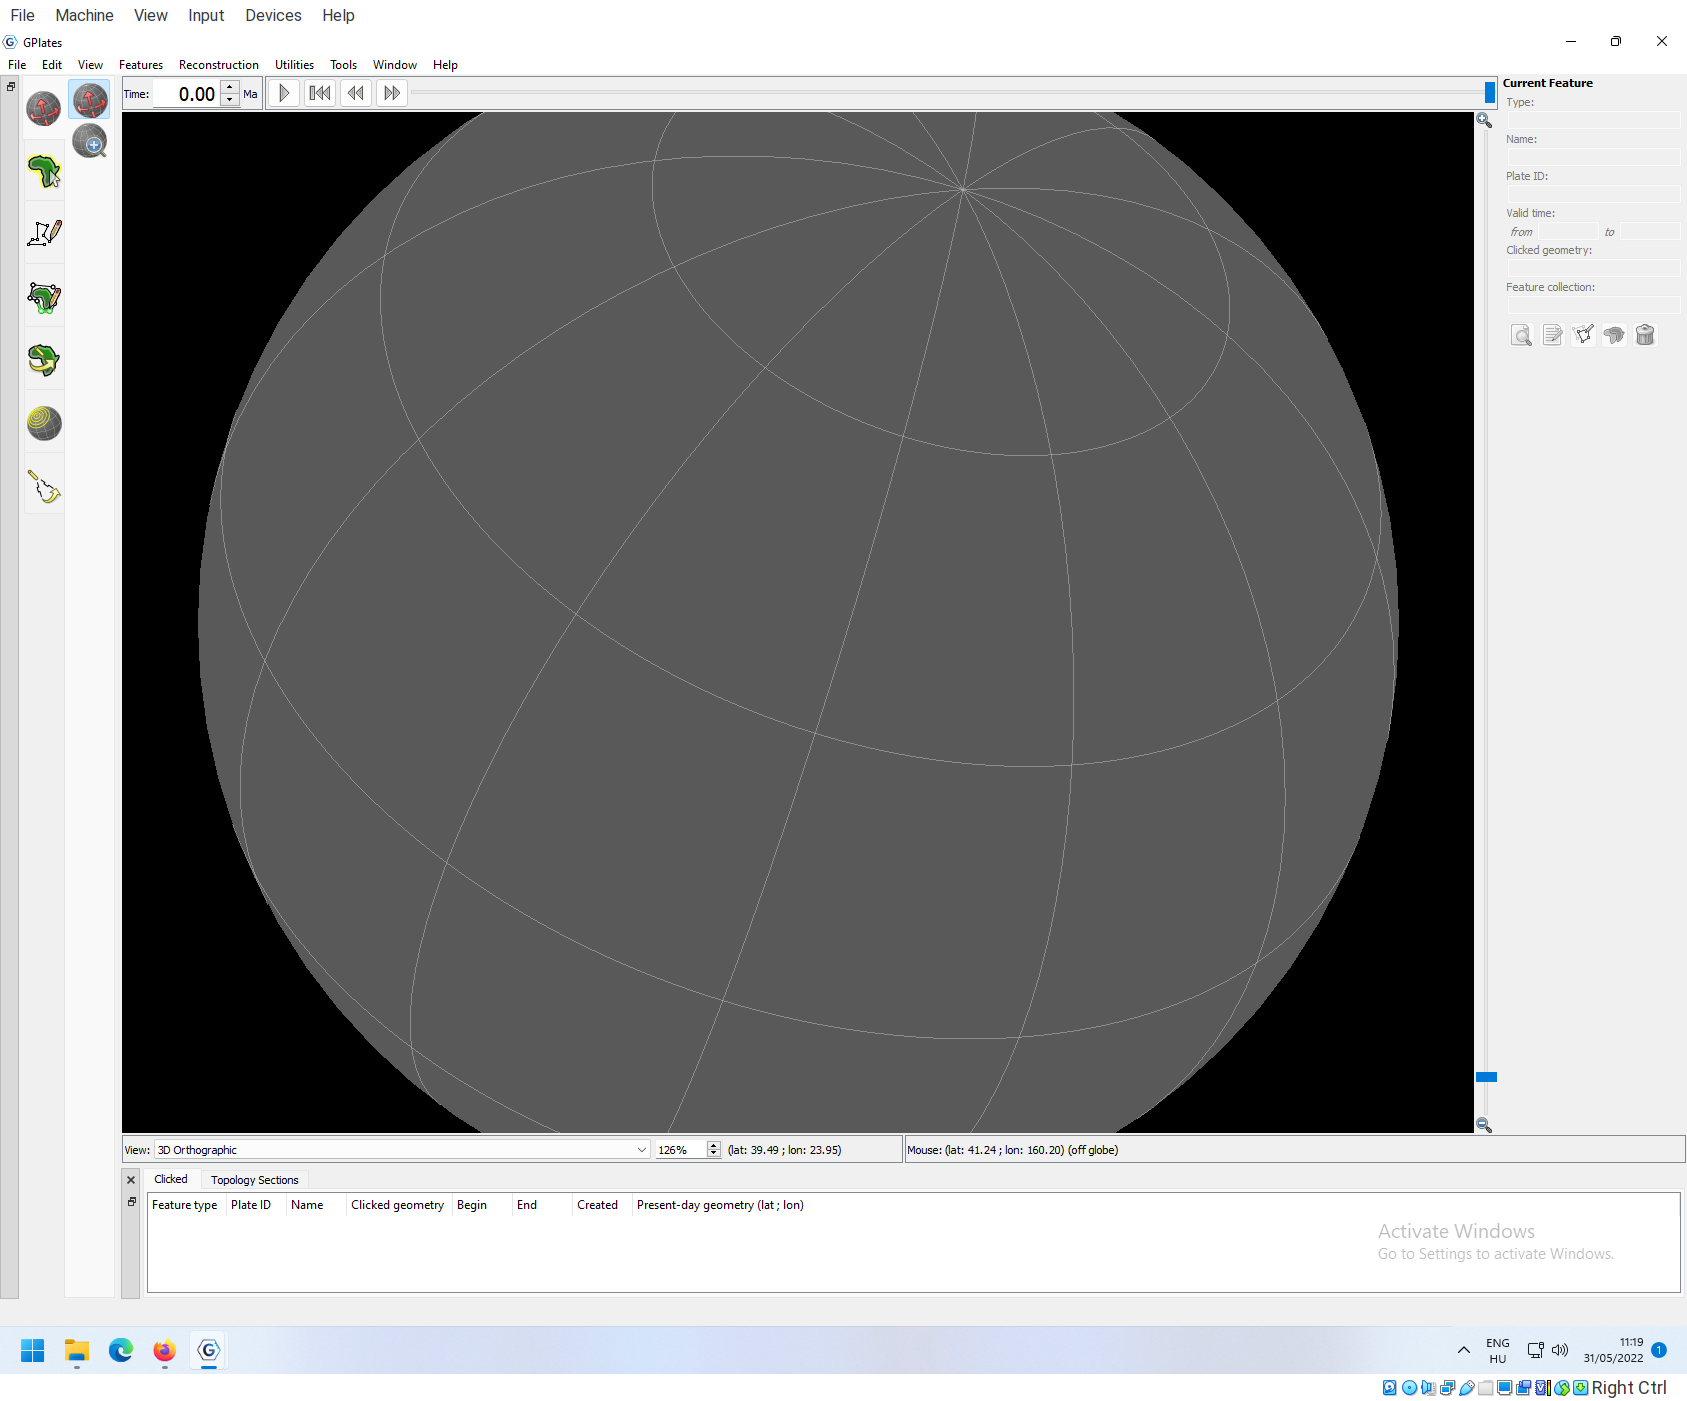
The black (log) window displays technical data about the current session, you can safely ignore this, and maximize the other (main) window. All activities will happen there:
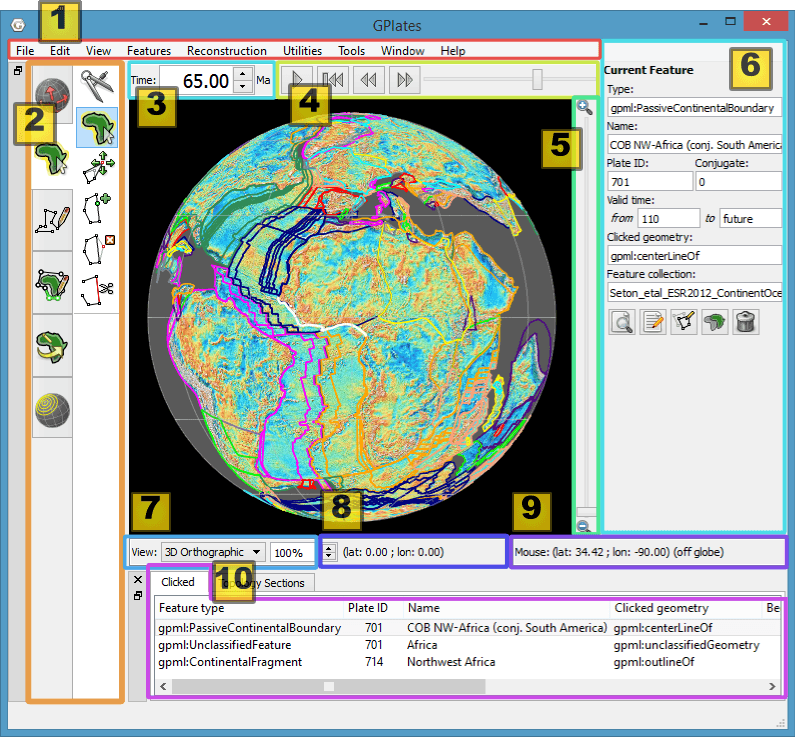
The main window has these main panels:
| Item | Name | Description |
|---|---|---|
| 1 | Menu Bar | This region of the Main Window contains the titles of the menus. |
| 2 | Tool Palette | A collection of tools which are used to interact with the globe and geological features via the mouse pointer. |
| 3 | Time Controls | A collection of user-interface controls for precise control of the reconstruction time. |
| 4 | Animation Controls | A collection of tools to manipulate the animation of reconstructions. |
| 5 | Zoom Slider | A mouse-controlled slider which controls the zoom level of the Globe View camera. |
| 6 | Task Panel | Task-specific information and controls which correspond to the currently-activated tool. |
| 7 | View Control | Controls which projection is used to display data and the exact zoom level as a percentage. |
| 8 | Camera Coordinate | An information field which indicates the current globe position of the Globe View camera. |
| 9 | Mouse Coordinate | An information field which indicates the current globe position of the mouse pointer. |
| 10 | Clicked Geometry Table | Displays a summary of each geometry or feature touched by the last mouse click. |
Feature: features are items of data in a GIS program like GPlates. This can be a single point, a line, a polygon, an itme containing information on how the continents moved (Reconstruction tree), or anything.
Reconstruction view
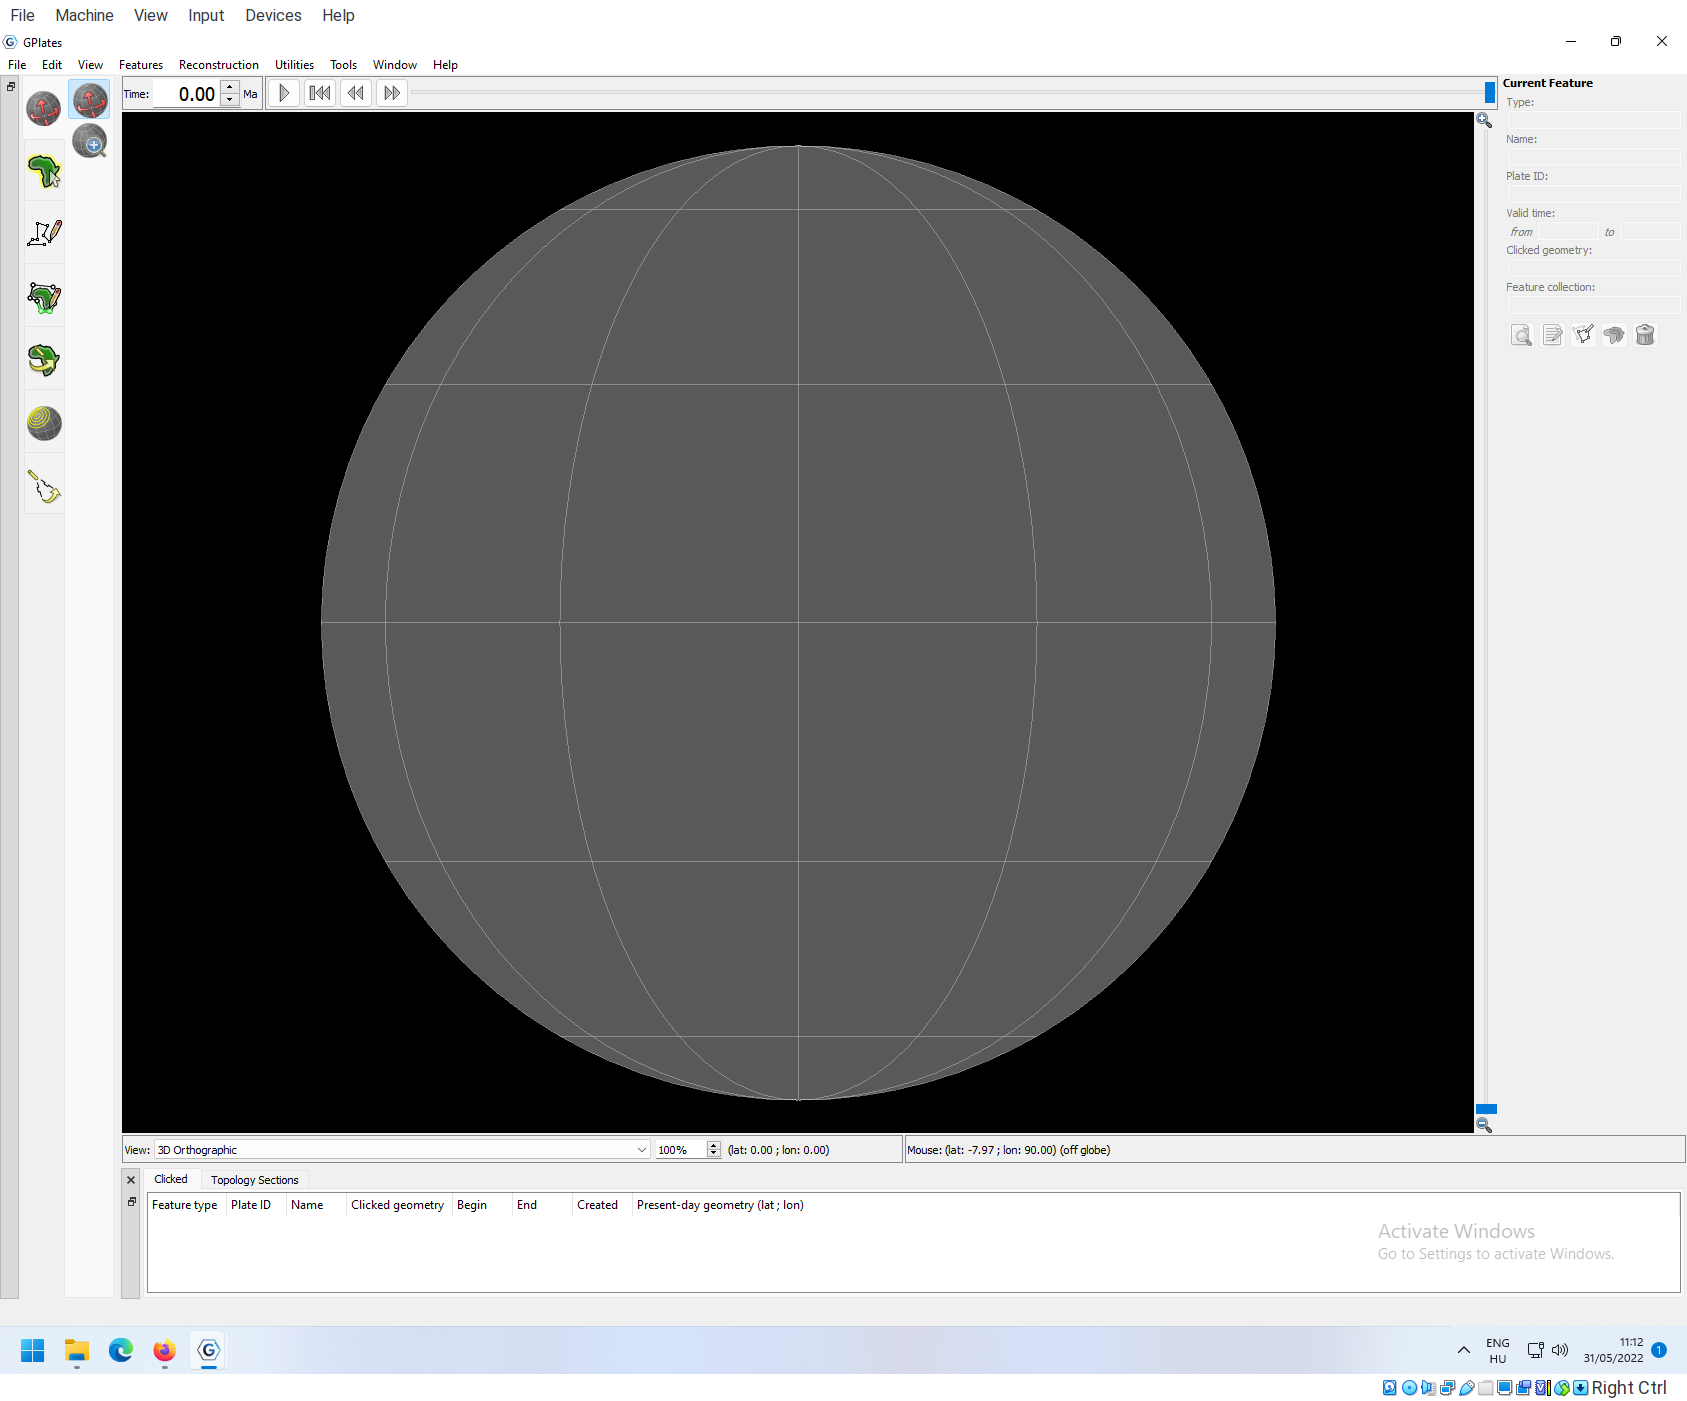
At the center you will see a 3d sphere rendered here. This is an interactive area, you can Left click and drag the sphere around to rotate it, and use the Mouse wheel to zoom in and out, adapting the point of view to your needs.
Below this viewport you will see a row of entries starting with View. The drop-down menu lets you select diferent ways how the the sphere is projected in 2D. What you have been seeing is an orthographic projection, but you can also select additional projection methods
-
Rectangular: This projection (also called equirectangular) displays longitude and latitude coordinates, as a 2D xy Cartesian coordinate system. The display ranges from -180° to +180° longitude, and -90° to +90° latitude. The grid lines are shown for every 30°.
-
Mercator: The Mercator projection is an angle-conserving projection that orginates from times when nautical maps were drawn. It is still used for zoomable interactive maps (e.g. Google’s maps). This property can only be guaranteed if the map elongates as the poles are approached (as a matter of fact, the poles are not shown here). You can see the distortion in the sizes of the 30-by-30° grid cells. The Mercator projection is notorious for distorting areas, you can check out how much with this nice web application.
-
Mollweide: This is a beautiful projection of the globe that happens to be also conserving areas, meaning that shapes will have the same relative areas on the map as on the surface of the globe. However, the projection is distorting the angles: the farther you go to the sides, the more pronounced the distortion will be.
-
Robinson: This projection is a nice compromise between both angle and area distortions. It is also promoted by National Geographic and the IPCC, and is one of the least biasing depiction of a sphere on a two-dimensional surface.
Next to the drop-down menu, you can adjust the zoom, as with the mouse. The pair of coordinates next to this, tells you where the center of the viewport is. The next pair of coordinates to the right will tell you the coordinates that the mouse is currently pointing to.
The user interface will make more sense, once we have some data to work with. You can find more information on the user interface here.