Loading raster data
About raster data
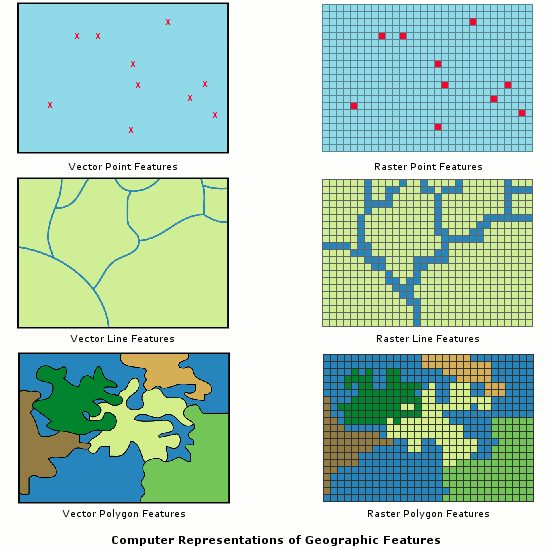
Rasters are the other kind of structures besides vector information that people frequently use to store spatial data. Raster (as the name implies) store data in regular grids, typically based on Gaussian (polar) coordinates. The methods and storage of values are very similar to those of raster graphics, the only difference is that the the grid is georeferenced, i.e. we know exactly where the cells or grid points are on the surface of the Earth.
Here is a simple comparison between different kinds of vector and raster data (see source here):
Raster data in GPlates
Although it was not primarily designed for the manipulation of raster data, GPlates also has the capability of visualizing such information. A number of example datasets are installed automatically with GPlates. These can be loaded with the File -> Open Feature Collections menu item.
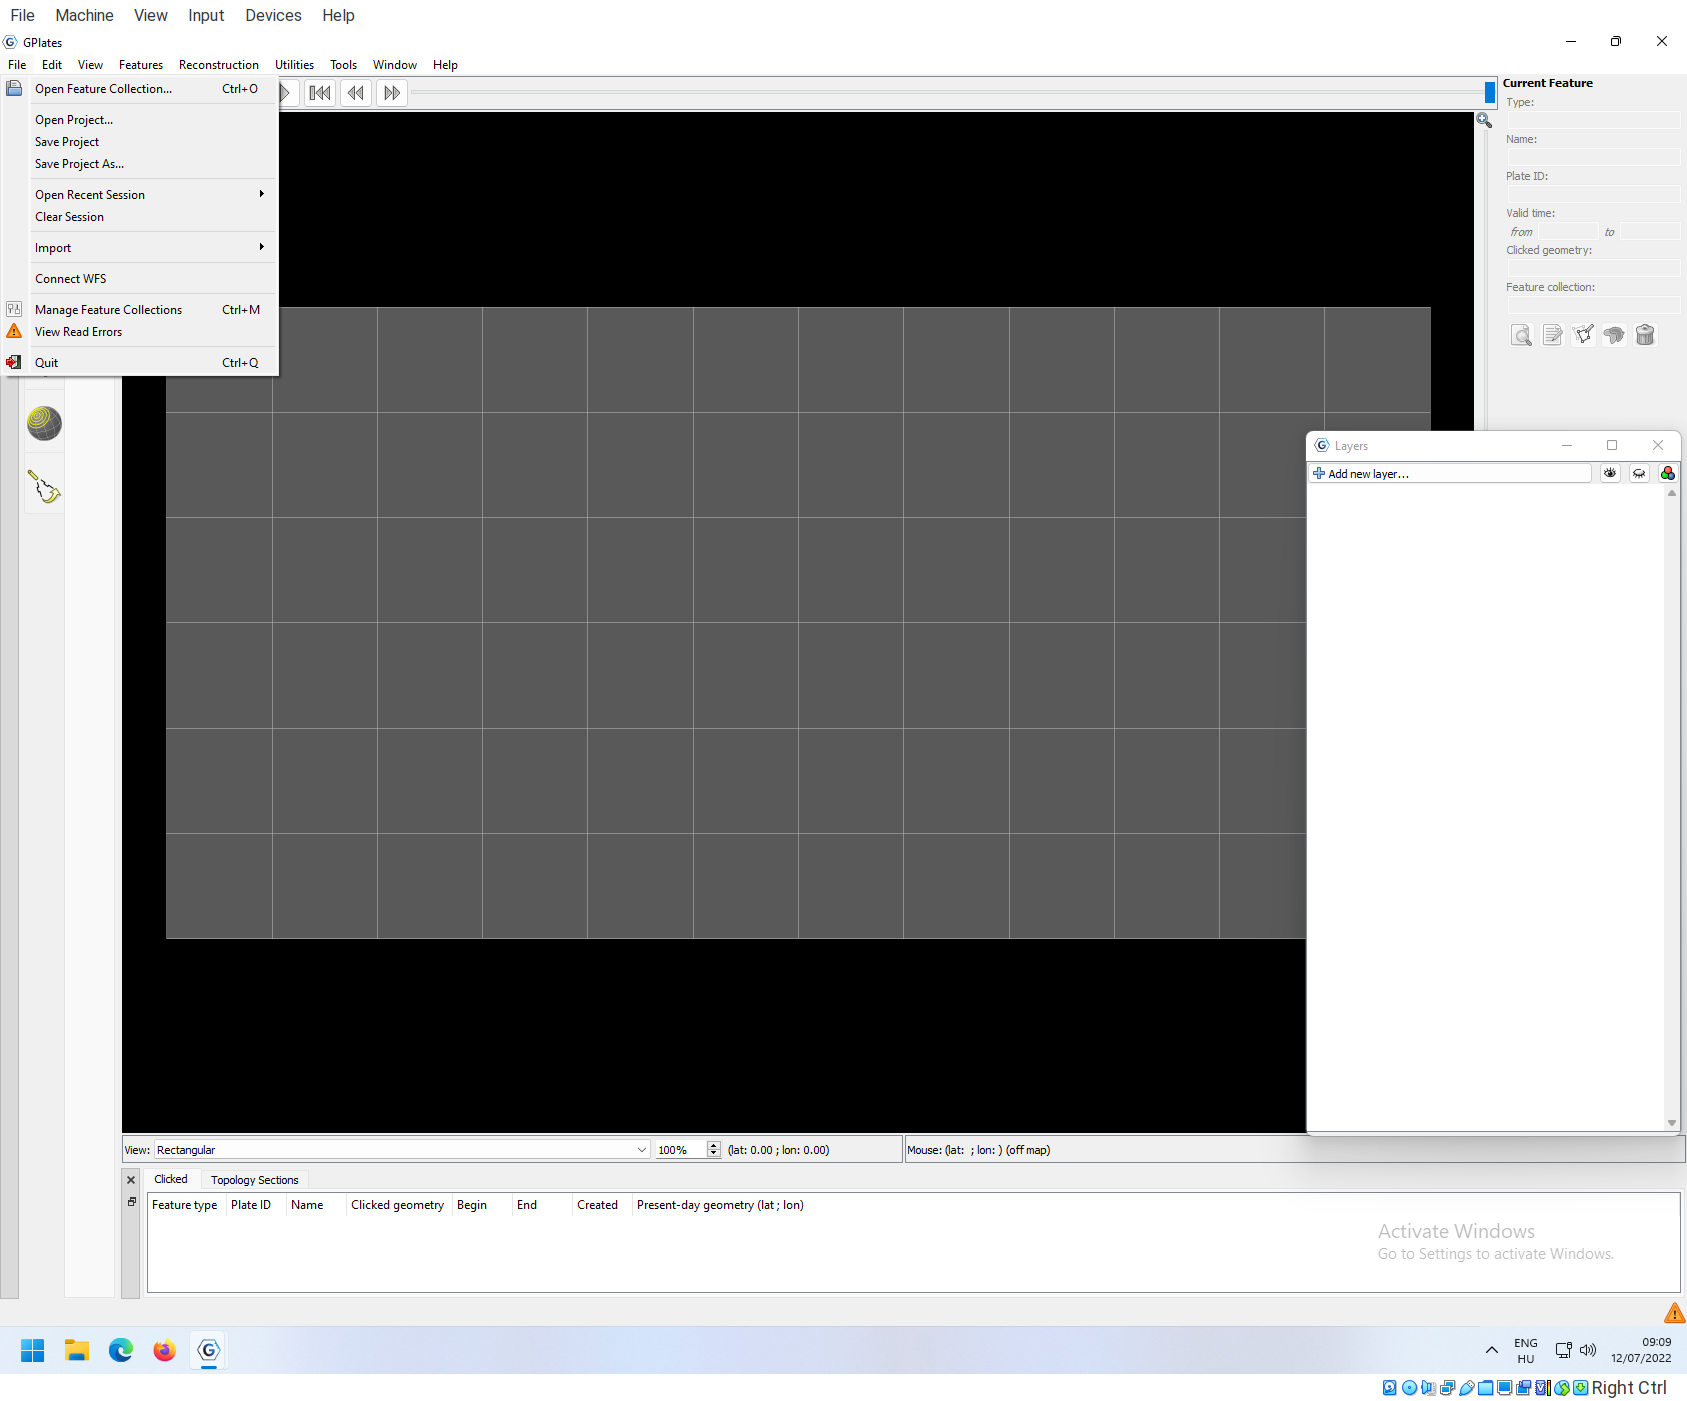
Installed examples are in the GeoData/Rasters directory.
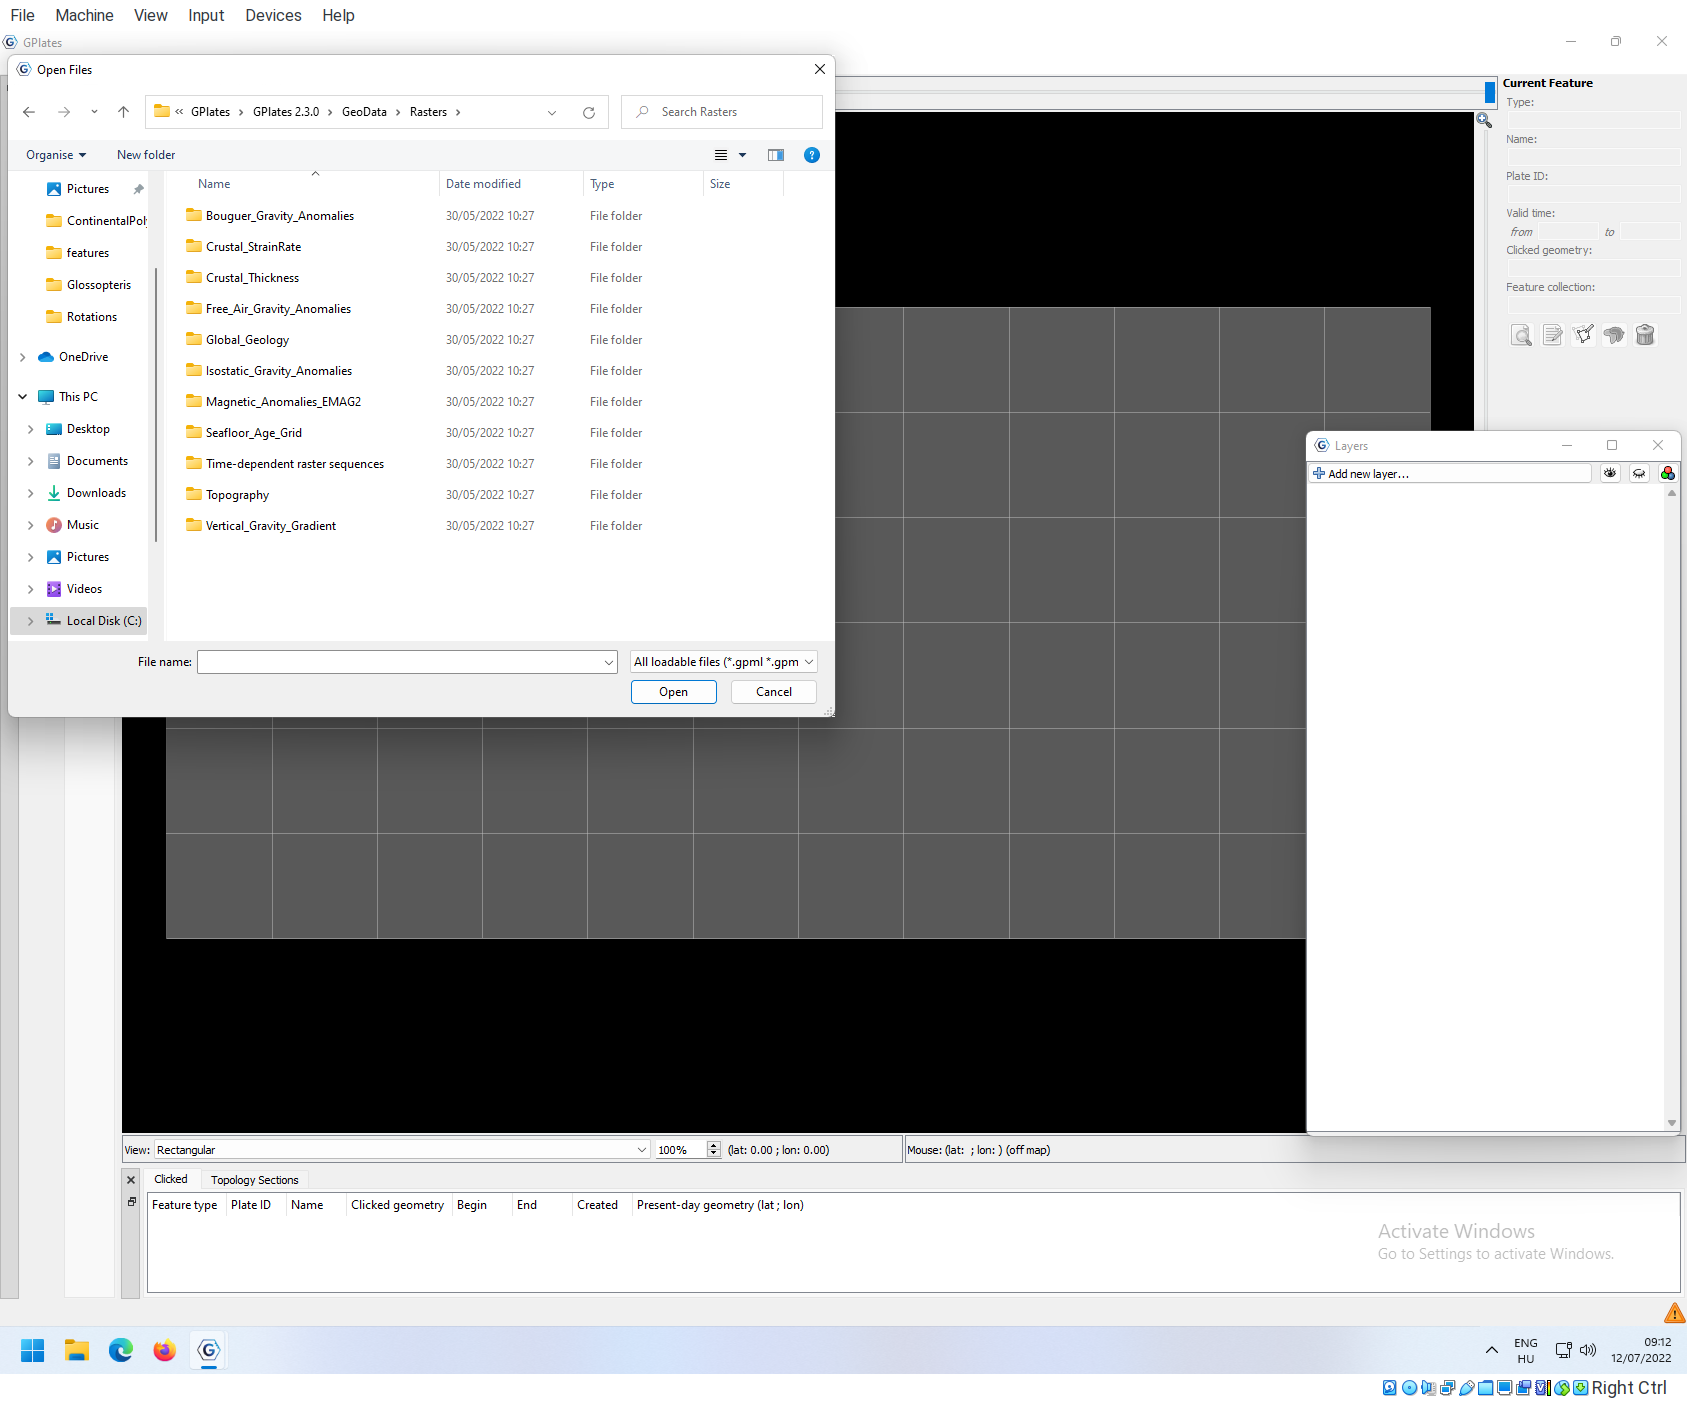
Seafloor ages
They are all geological data of different kinds. The simplest kind of raster data render a single value to every cell in a grid: for instance an age value.
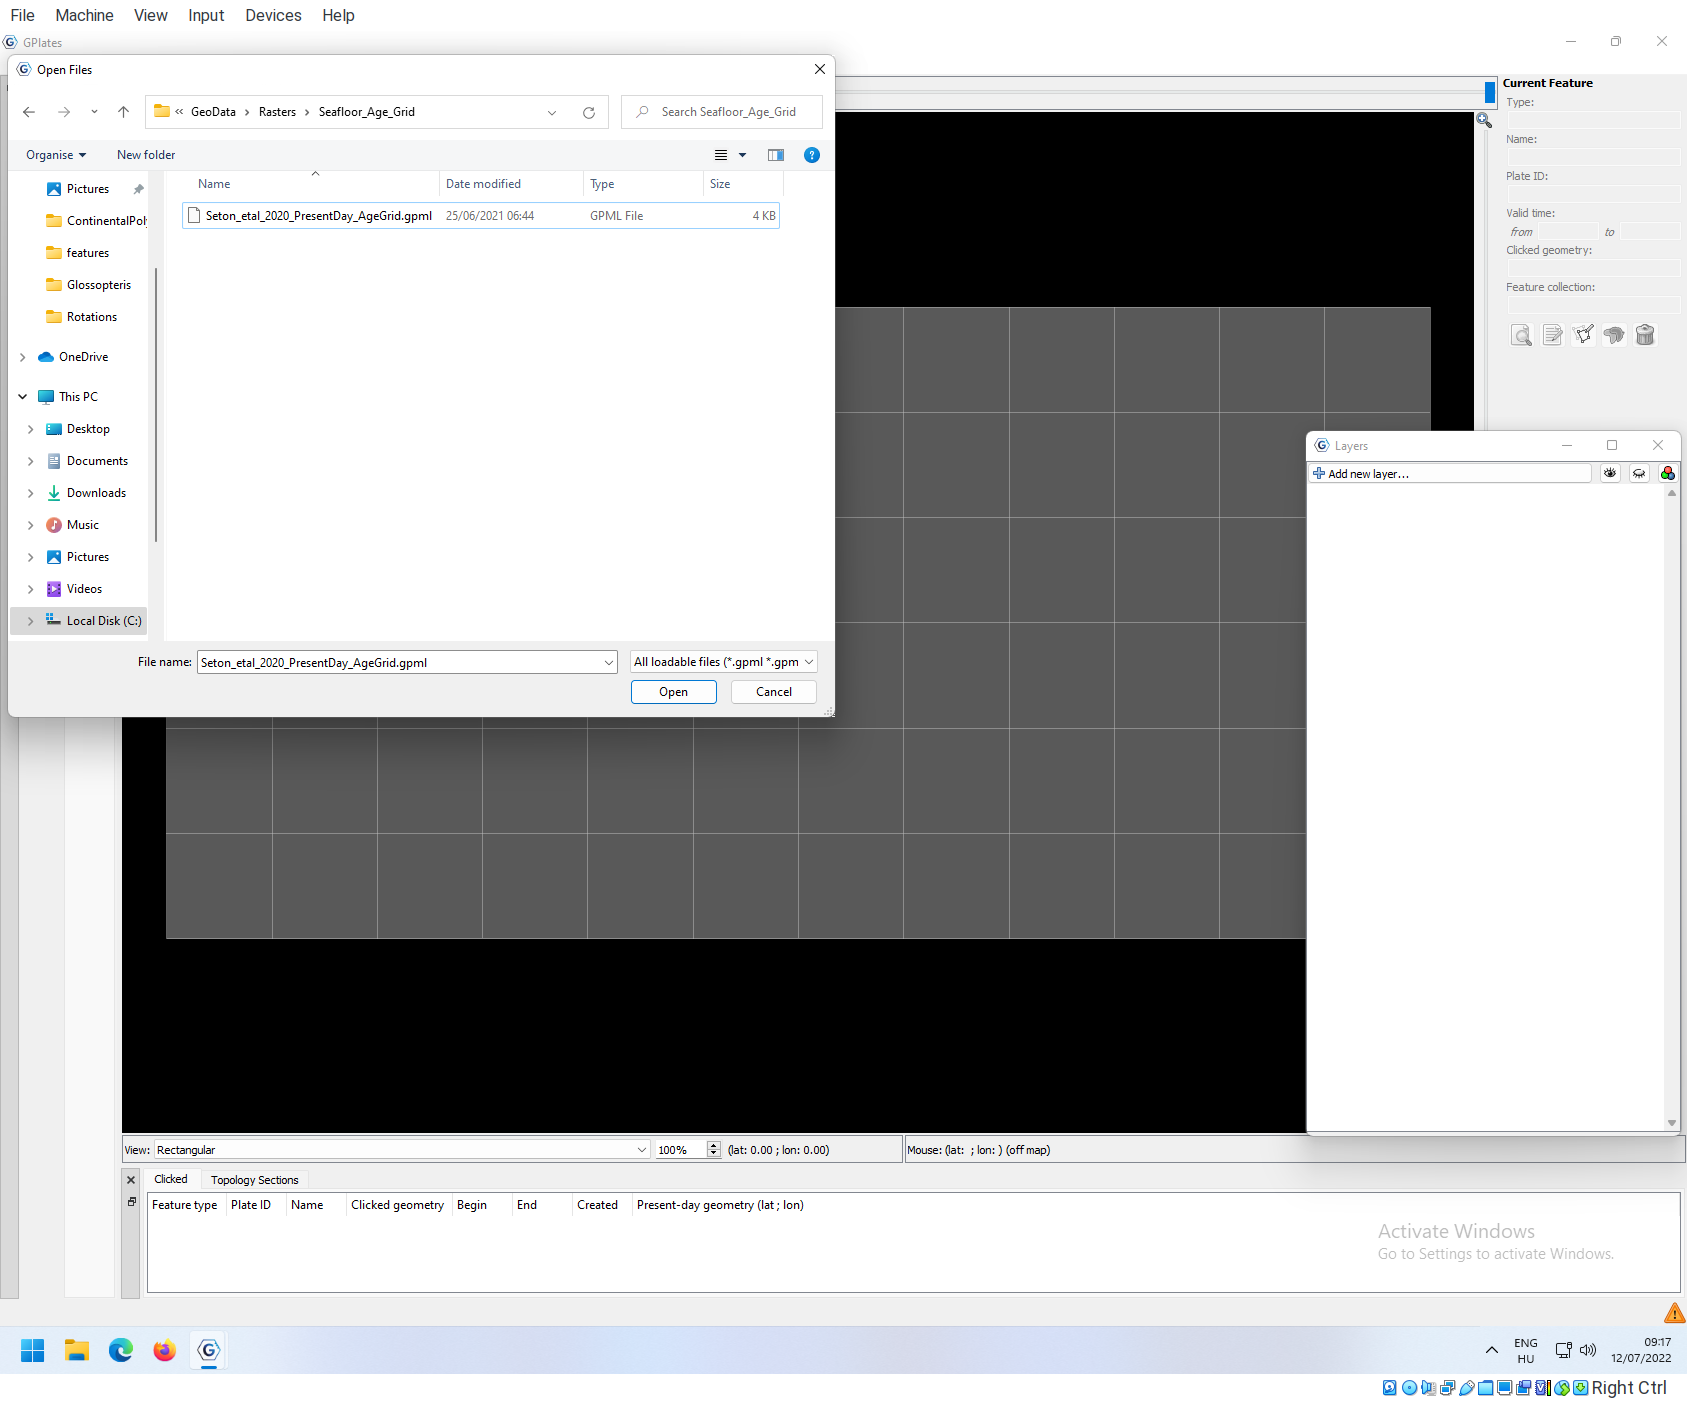
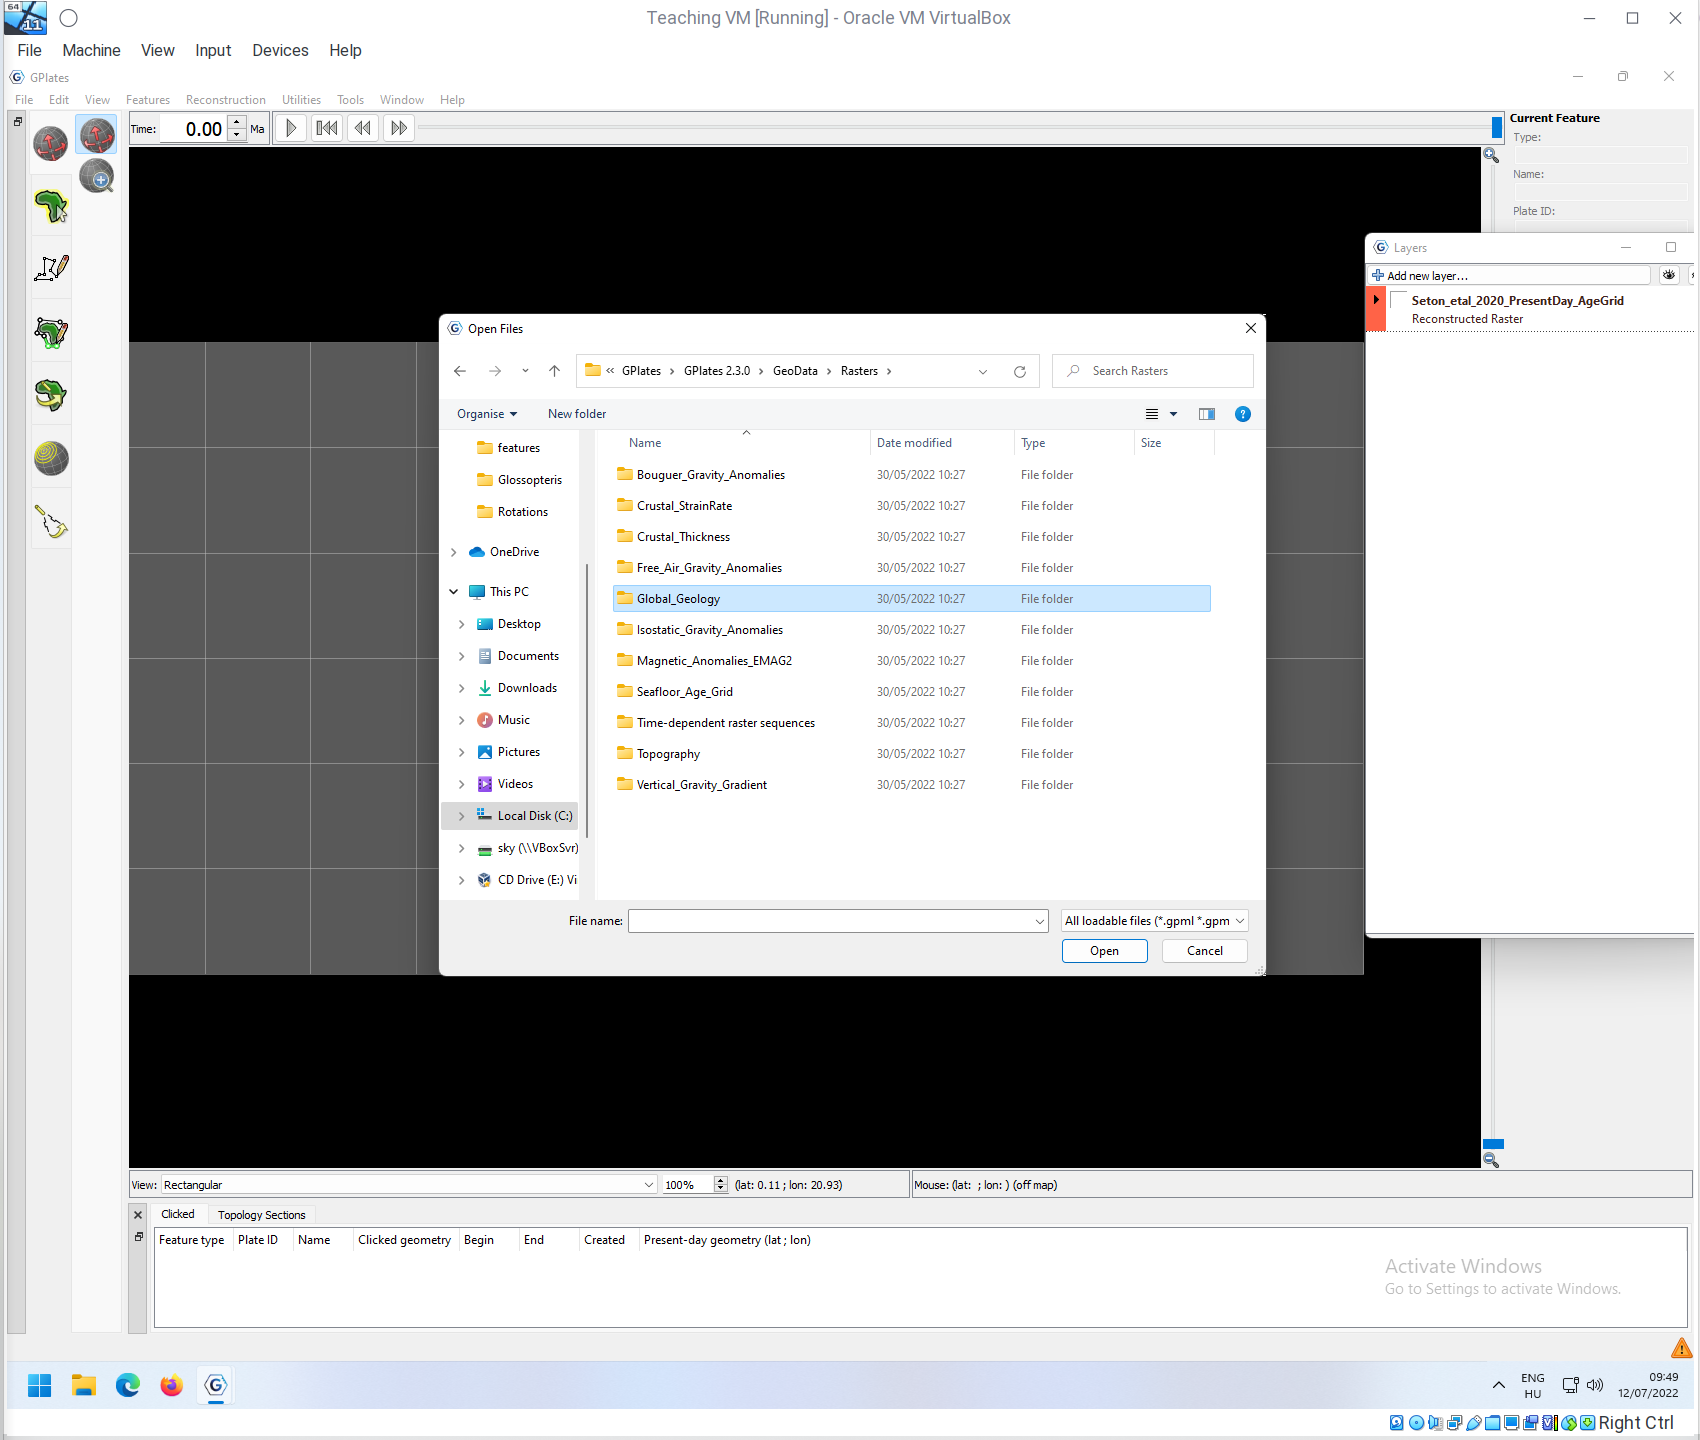
Go to the Seafloor_Age_Grid directory and open Seton_etal_2020_PresentDay_AgeGrid.gpml!
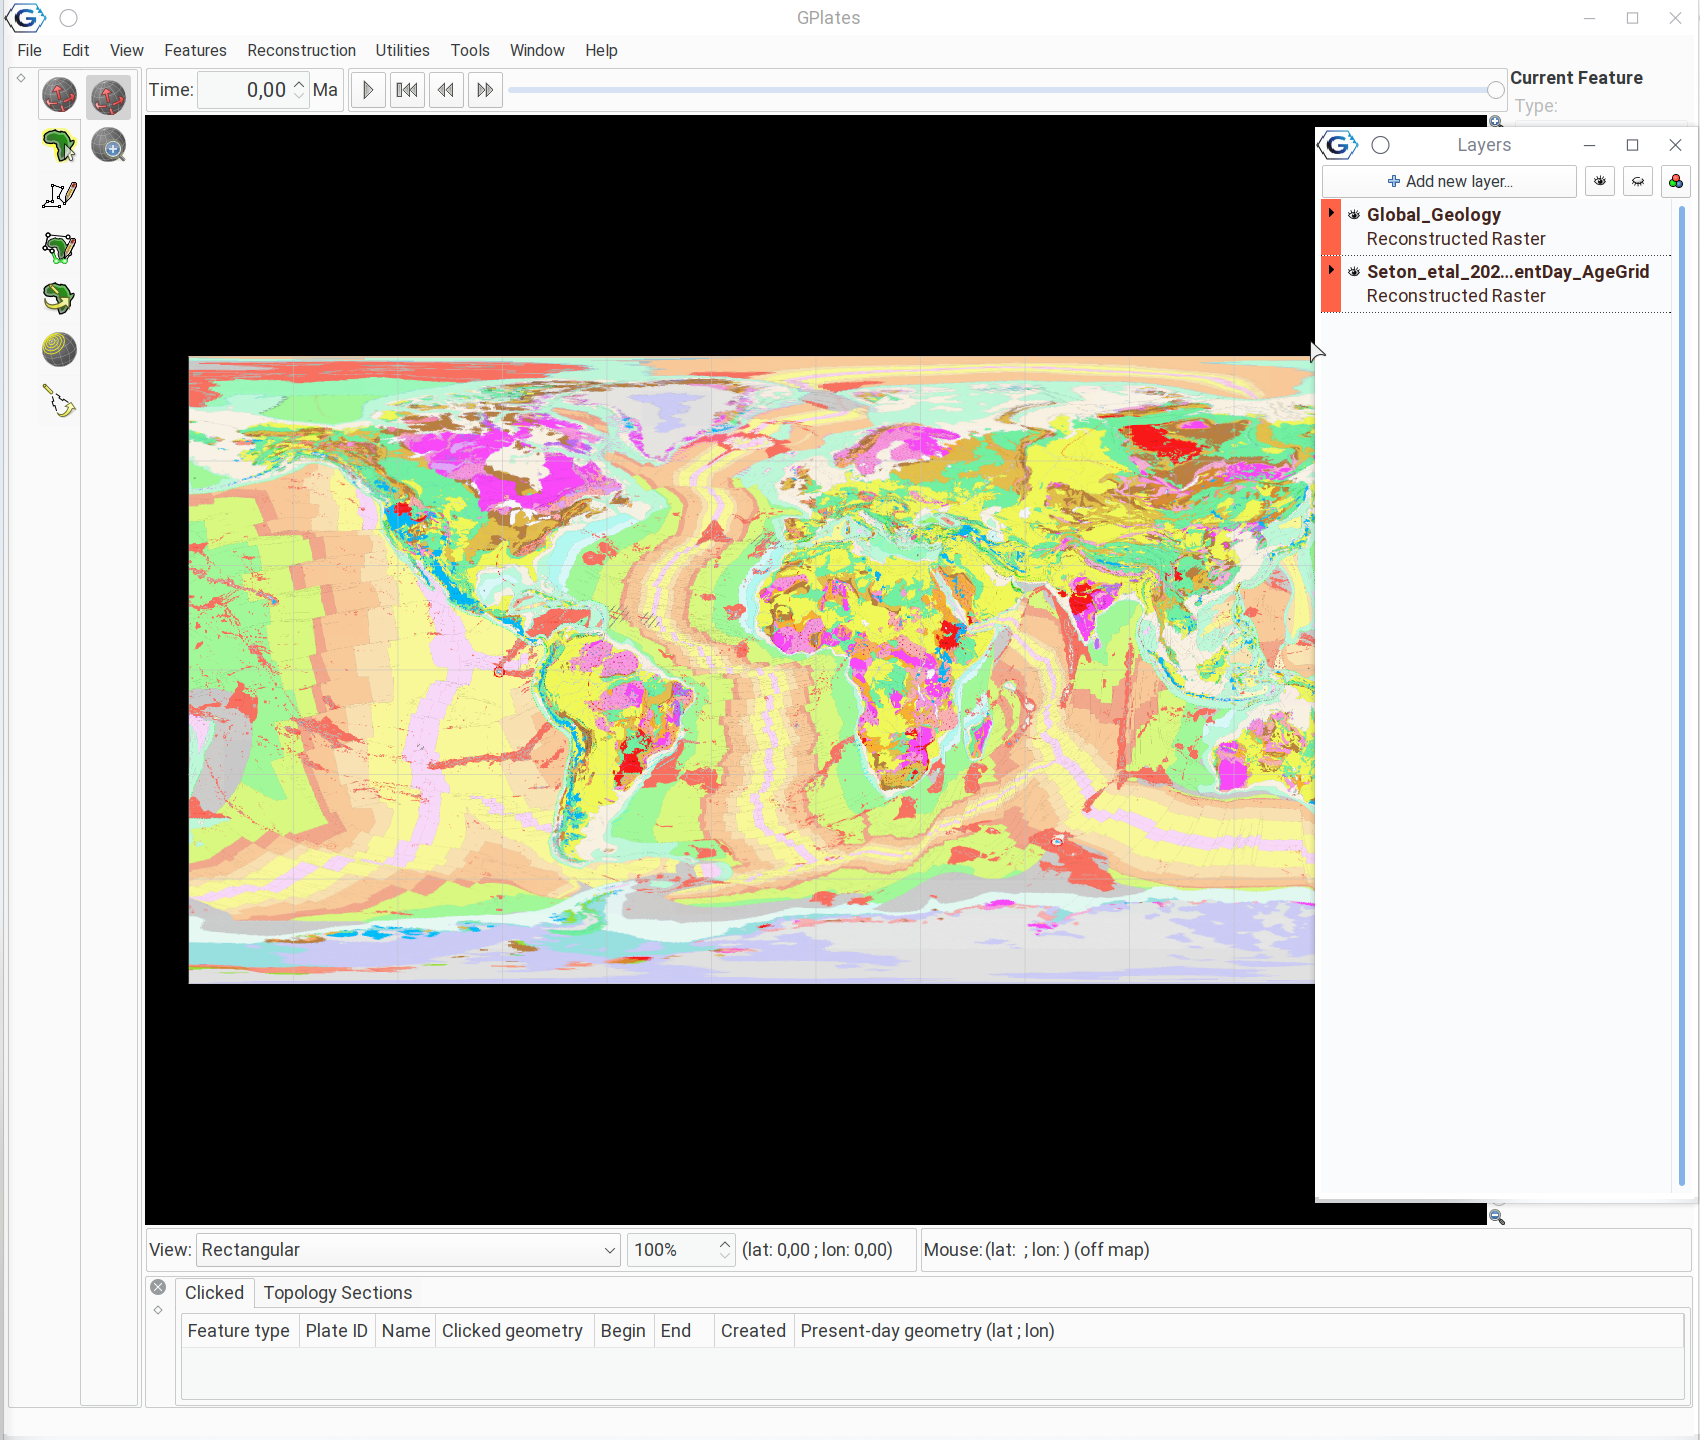
The loaded data appears in the Layers panel with the red color. You should also see a colorful map of the oceans appearing.
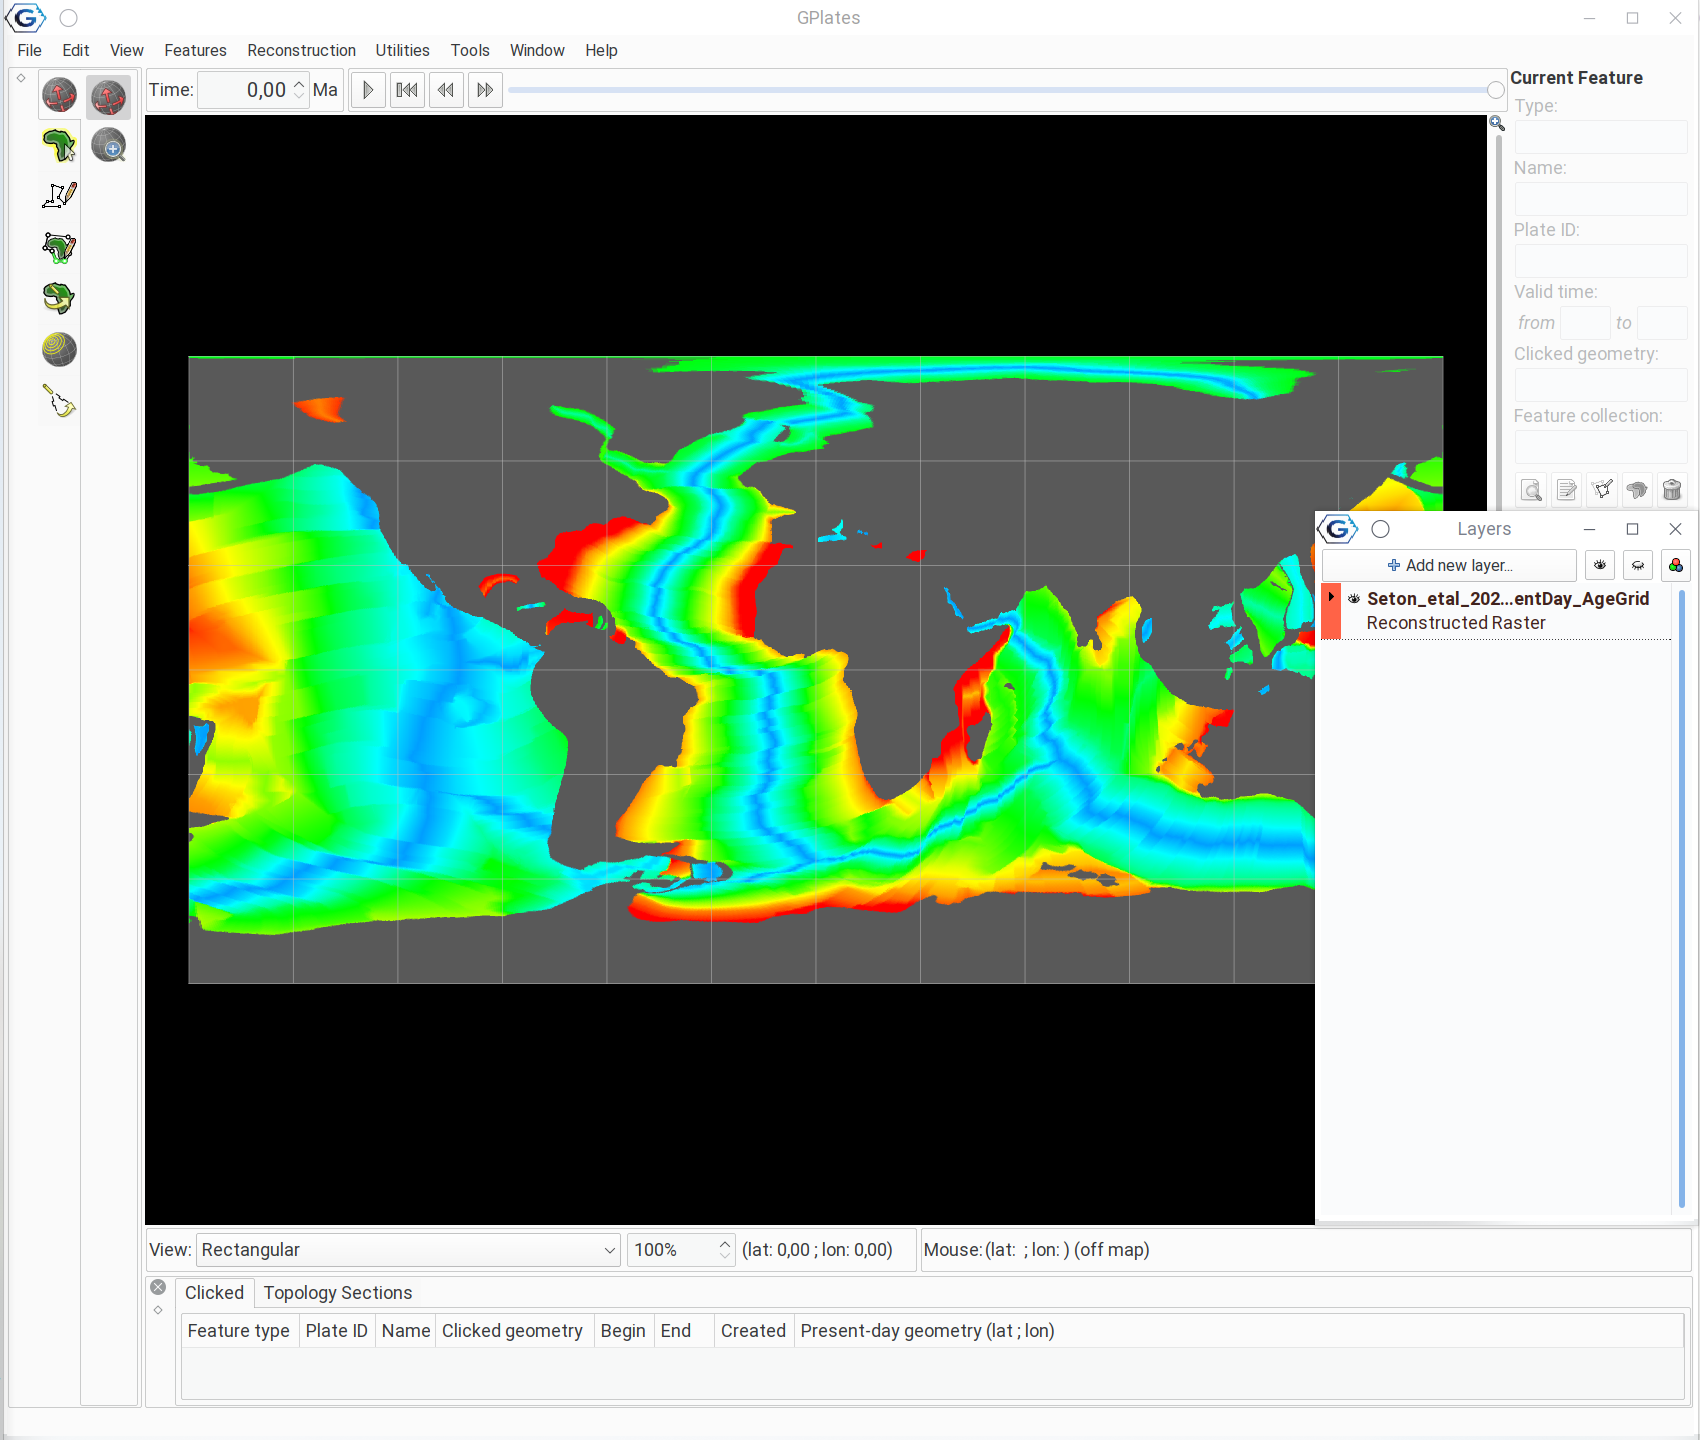
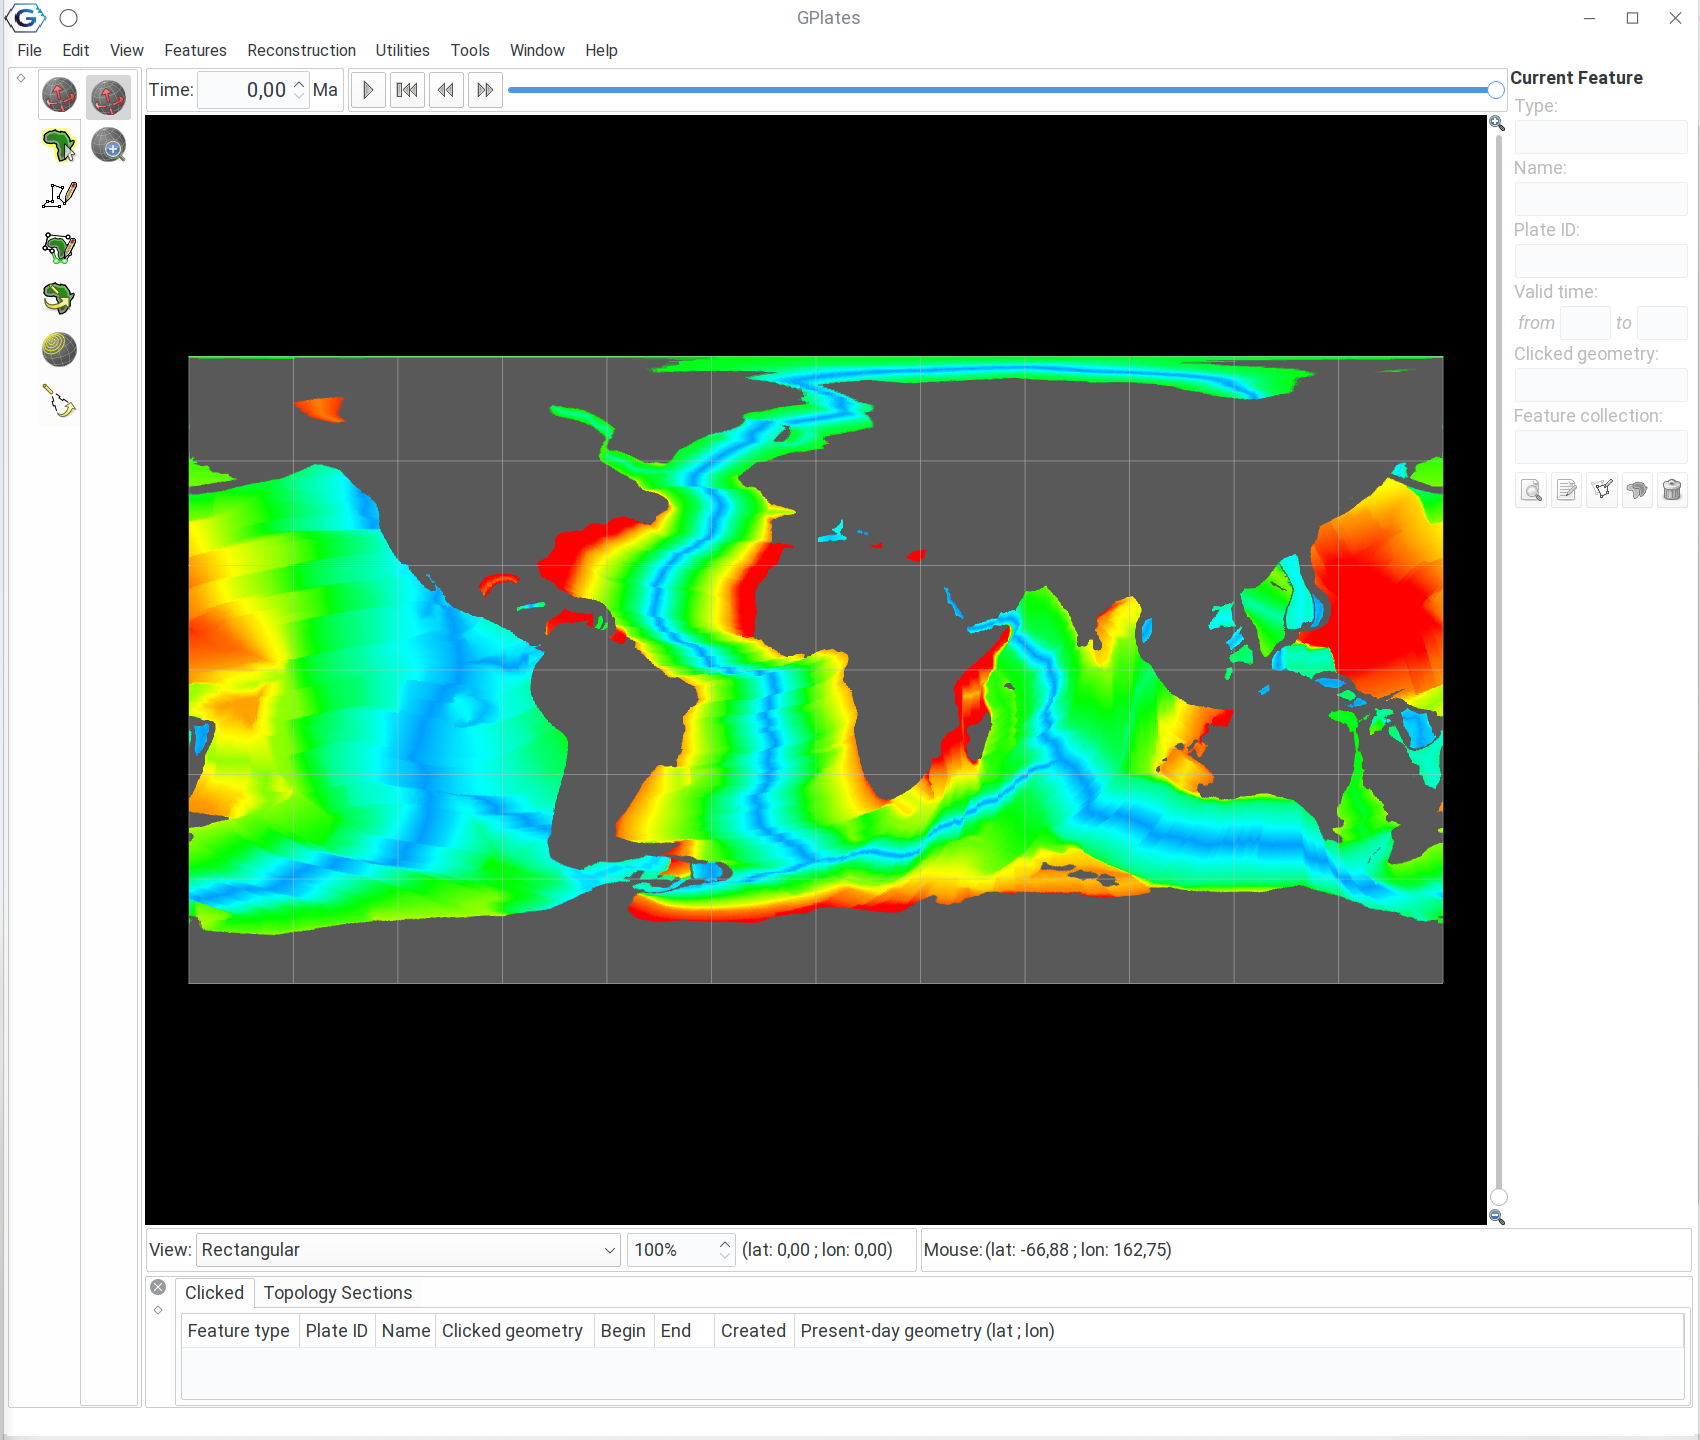
The map shows the age of of the seafloor as it is today. Simple raster data are typically shown as heatmaps like this: in this case the more redish the color is, the older the age. This raster is invariant in time, if you want to change the reconstruction age to something else, the map will remain the same.
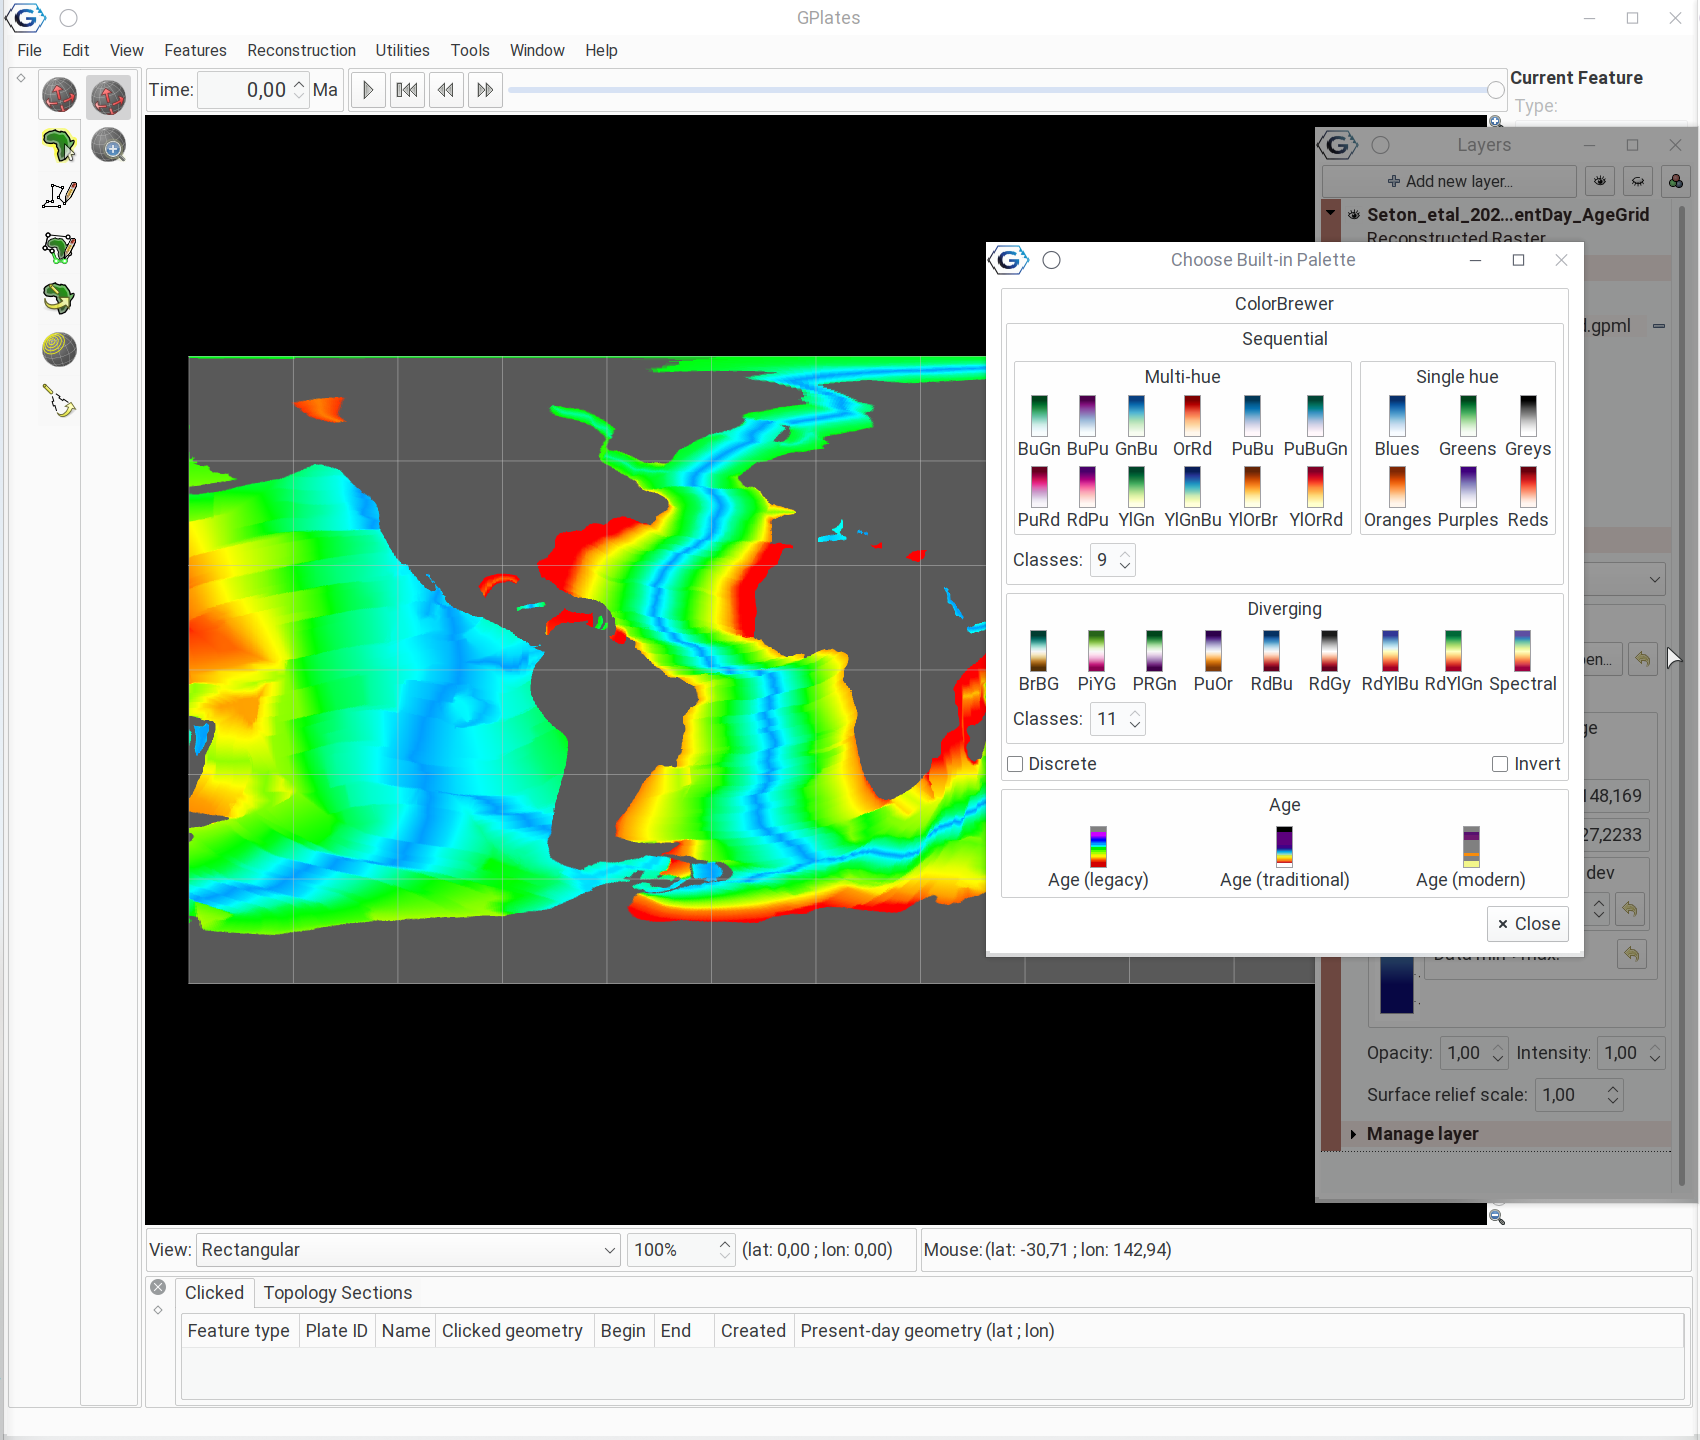
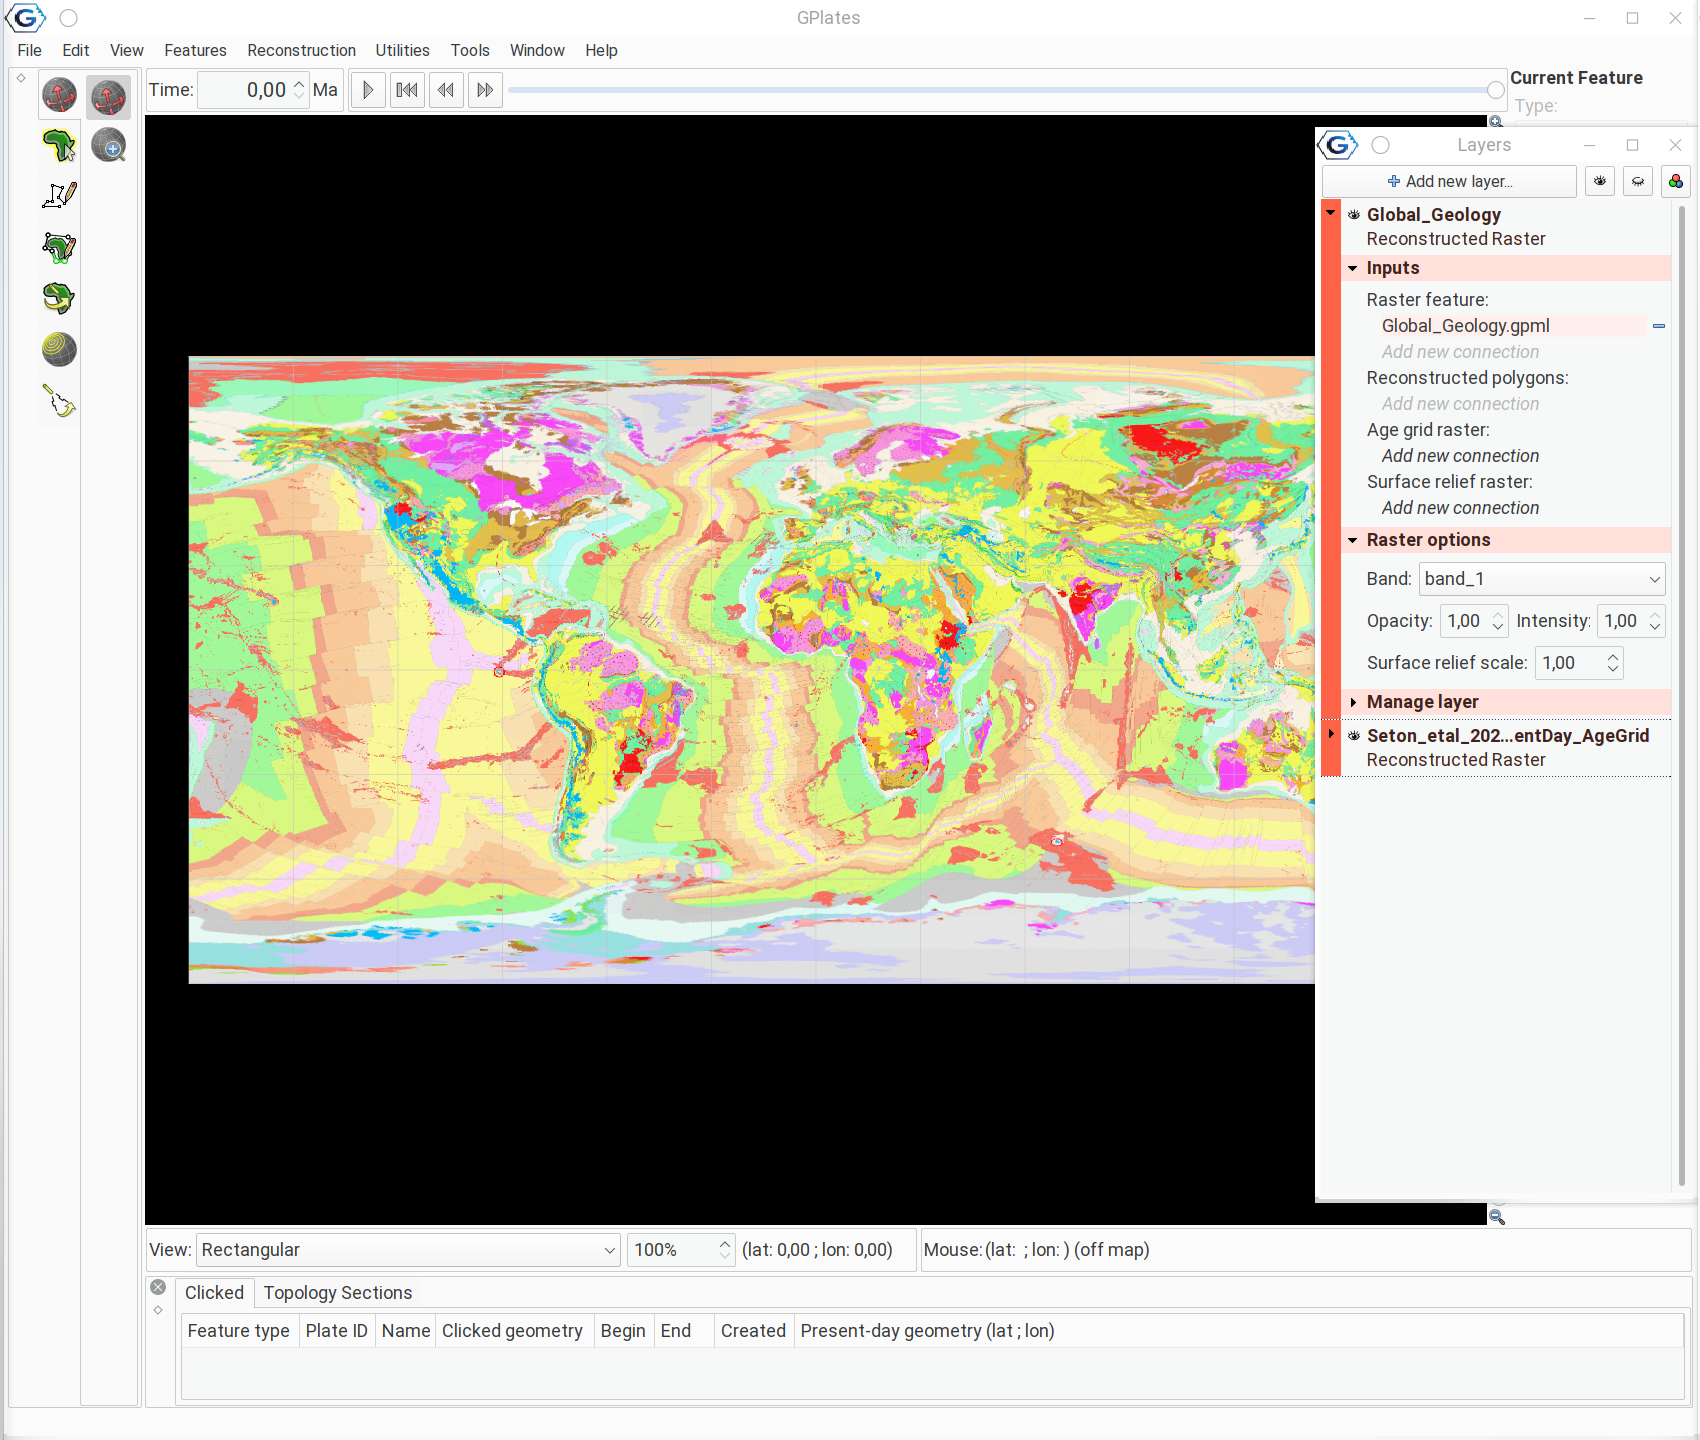
Clicking on the little arrow on the Layers panel next to the name of the layer will show the rest of the options, such as the opacity of the layer and the color intensity.
In the Raster options you can see the a drop-down menu called Band. This allows you to select which part of the raster file is actually displayed. This is important because many raster data contain multiple bands (e.g. dimensions). In our case, we only have one: band_1, which is fine as it is.
You can also adjust what how the values are mapped to the colors in the Raster options. Clicking on Choose Built-in Palette allows you to set the palette to any that comes with GPLates:
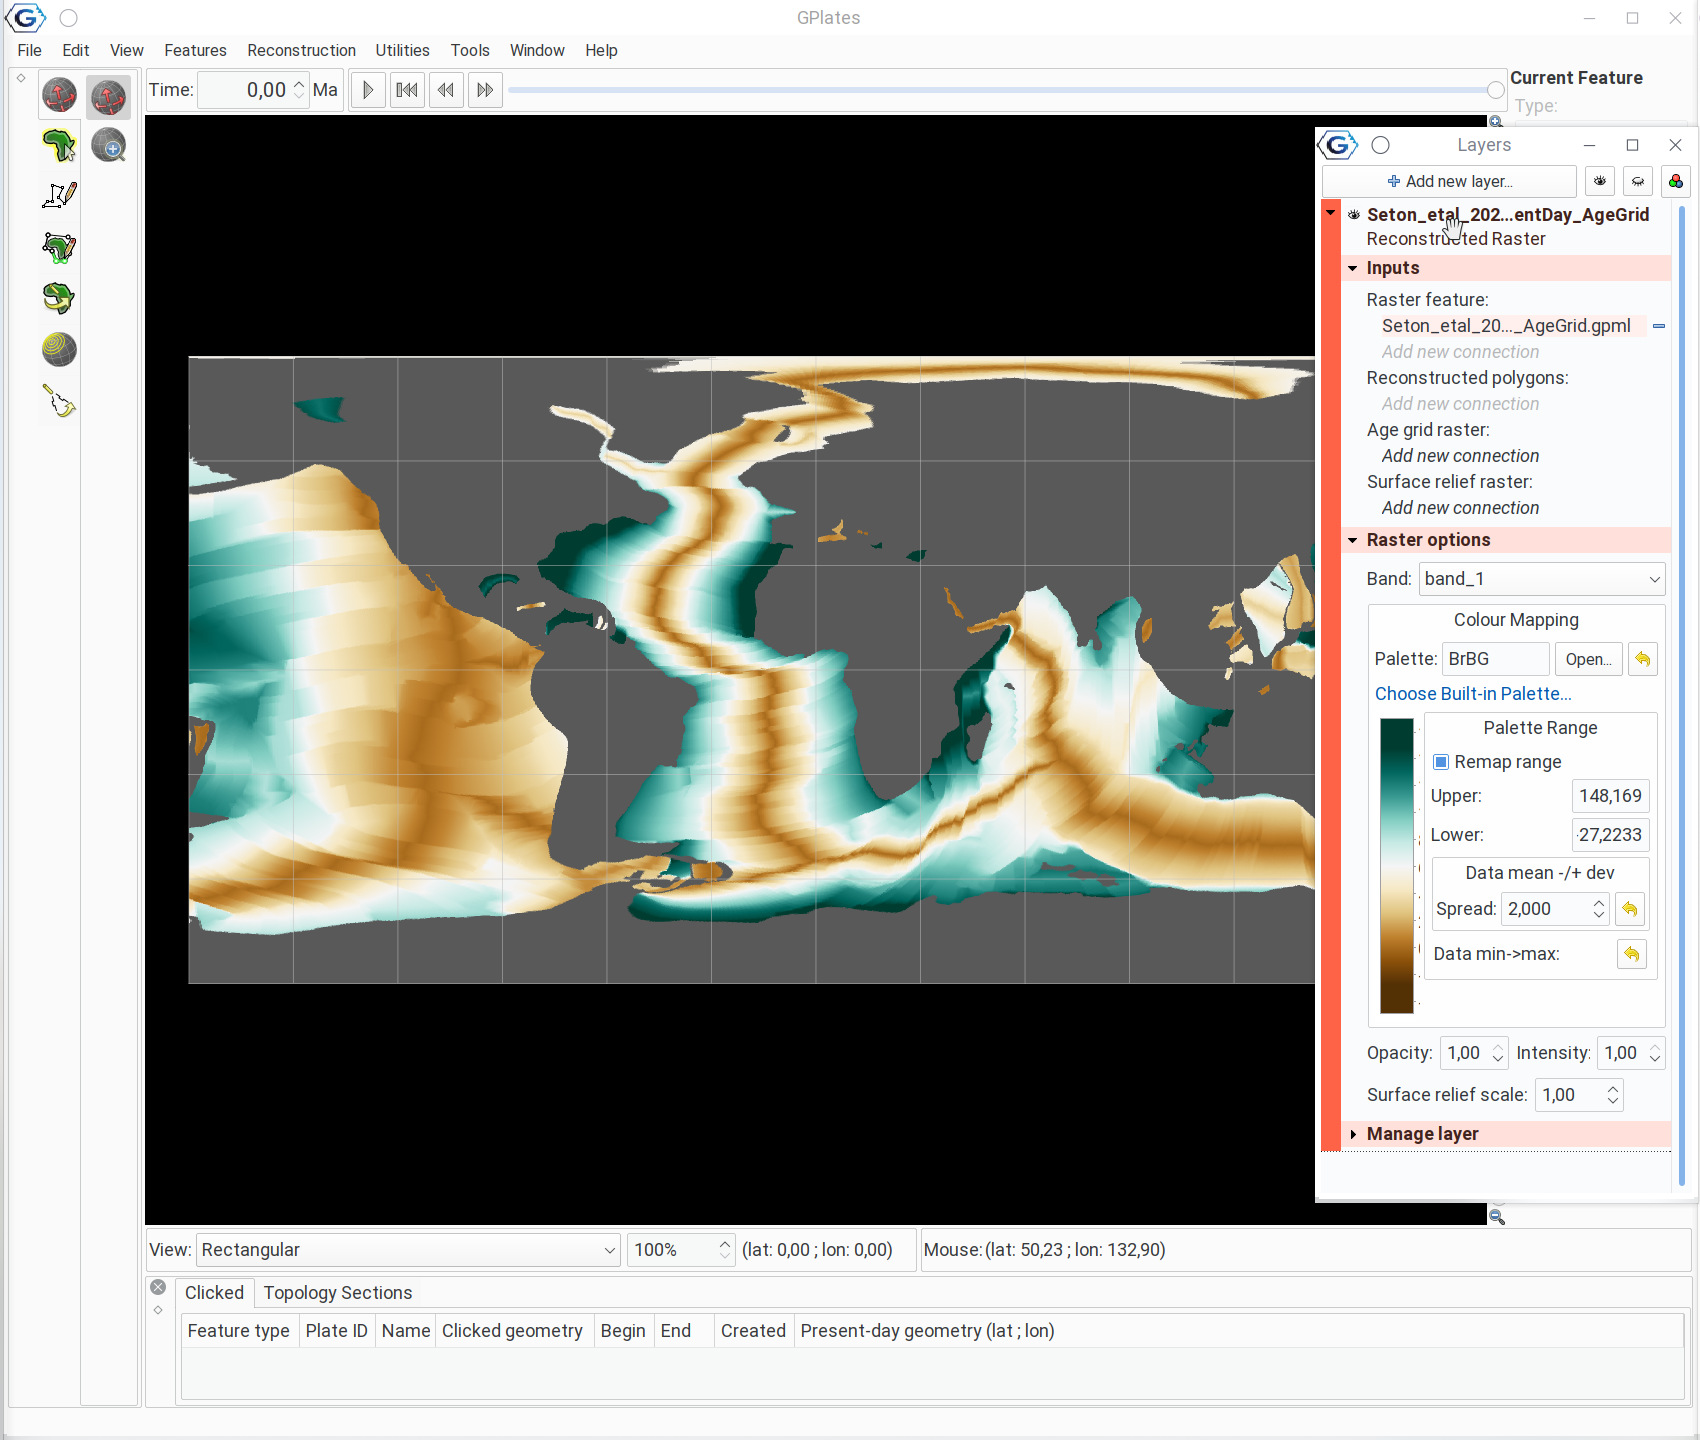
The images changes as such, when you select the BrBG palette:
A geologic map of the world
As mentioned above, computer images are also raster data, which means that they can displayed as such. GPlates comes with a geologic map of the world that you can load in with the File > Open Feature Collections menu item.
If you go back to the Rasters directory, you should see one called Global_Geology.
Enter this directory and open Global_Geology.gpml! You should see a similar map, which is the geological map of the world:
The difference between this raster and the previous one is that thi sis actually an image, rather than values assigned to every grid cell. You can see the limited number of options if you click on the little triangle next to the name of the layer:
In reality this, is also just a set of numbers: every color that you see is made up of three different numbers: the intensity of the red, green and blue subpixels. These cannot be manipulated in GPlates.
These rasters mostly serve as visualization purpose and guidelines for reconstructions. They do not change when the reconstruction date is changed - unless they are time-dependendent rasters.