Single point reconstructions
Introduction
All plate tectonic reconstruction reach their full utility, when we are able to tell where specific places, localities with present-day coordinates were in the past at a given point in time.
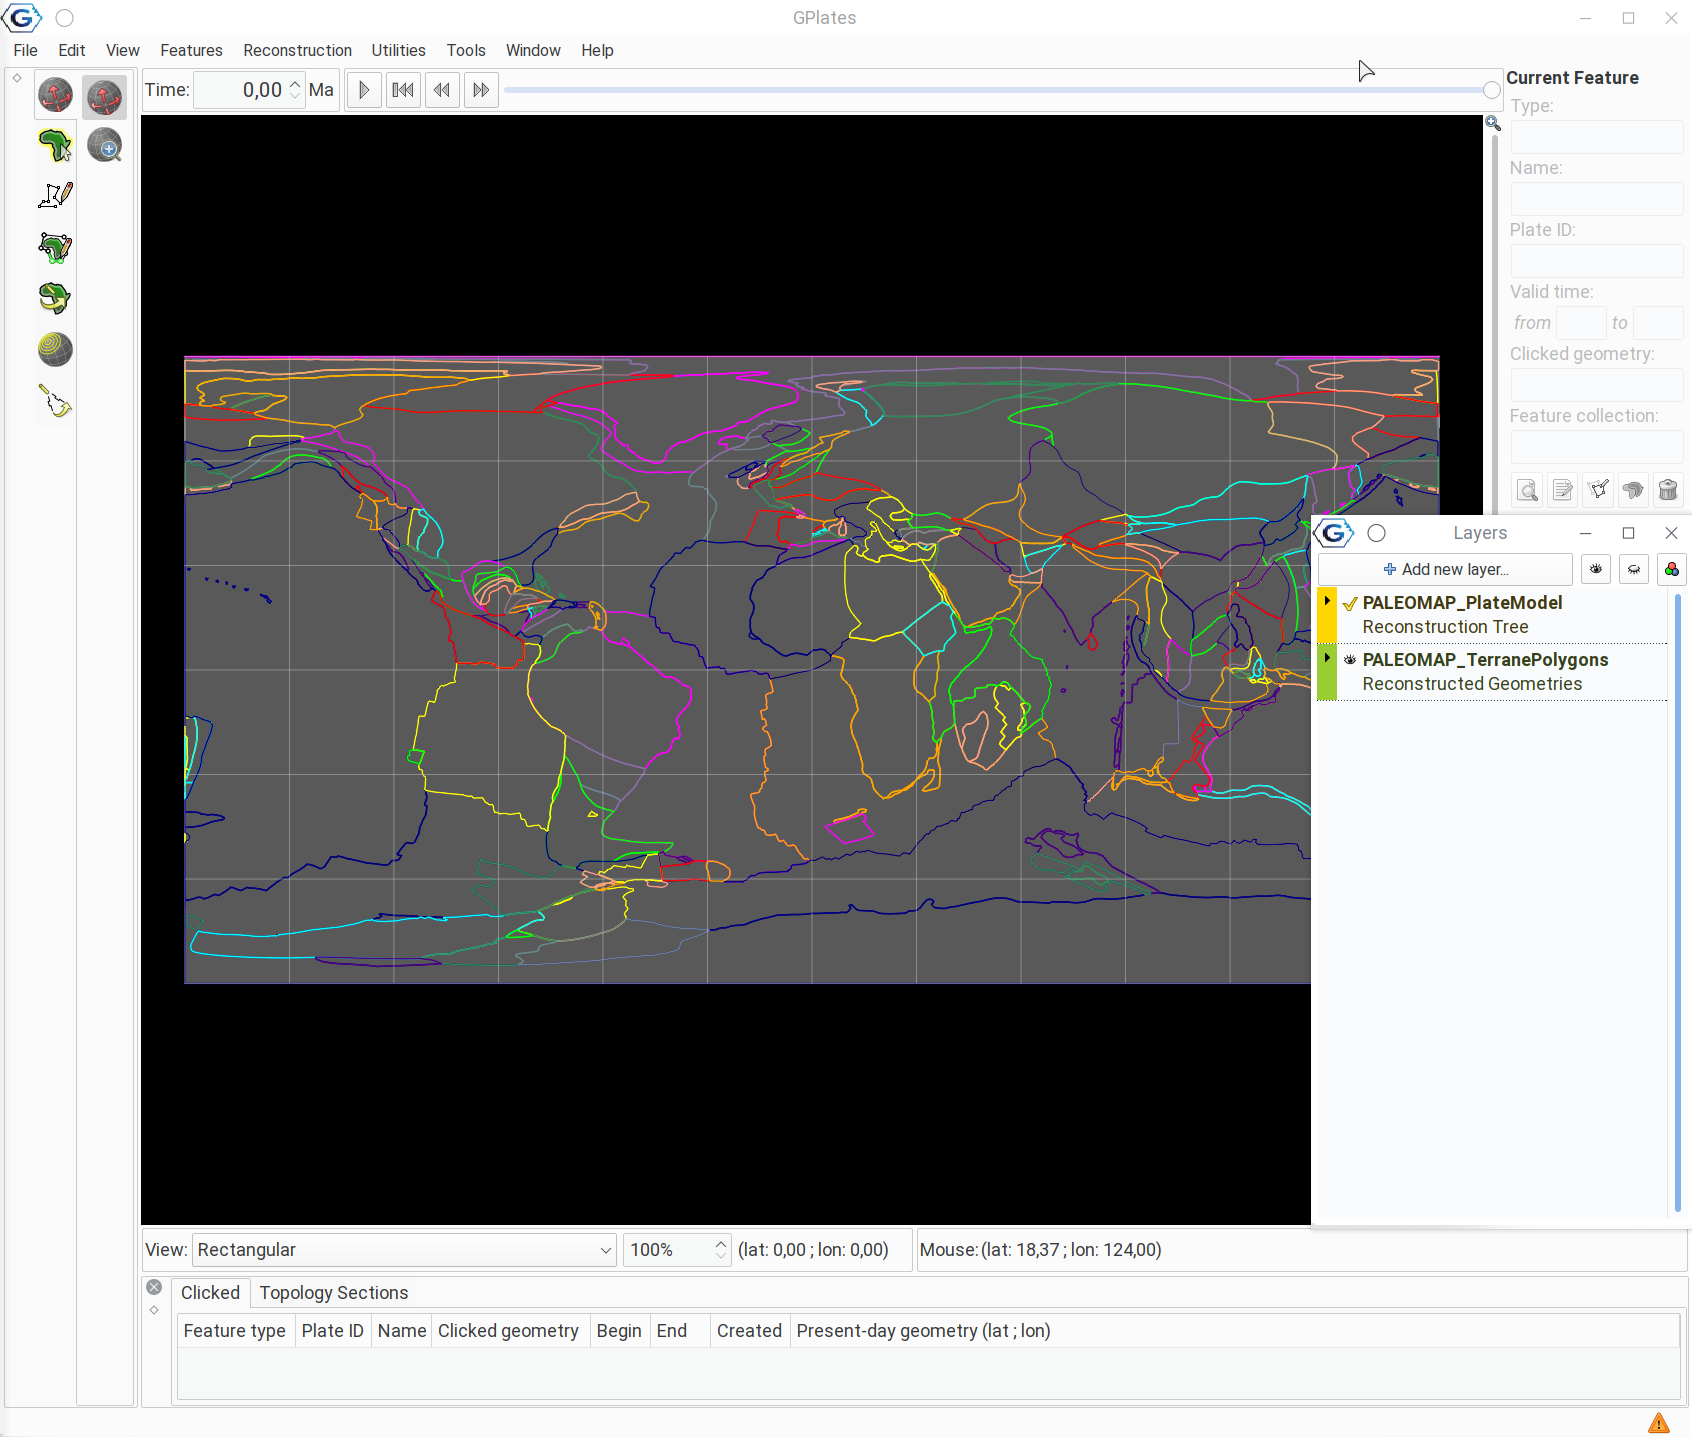
To illustrate the problems, let’s open the PaleoMap rotation file and the corresponding polygons, as in the previous tutorial:
Individual points
To reconstruct user-defined points, we have to create a new feature collection with the point, and assign it the appropriate plate ID. Let’s see where the City of London used be in the past. London has a present-day coordinates of around 0.1° longitude and 51.4° latitude.
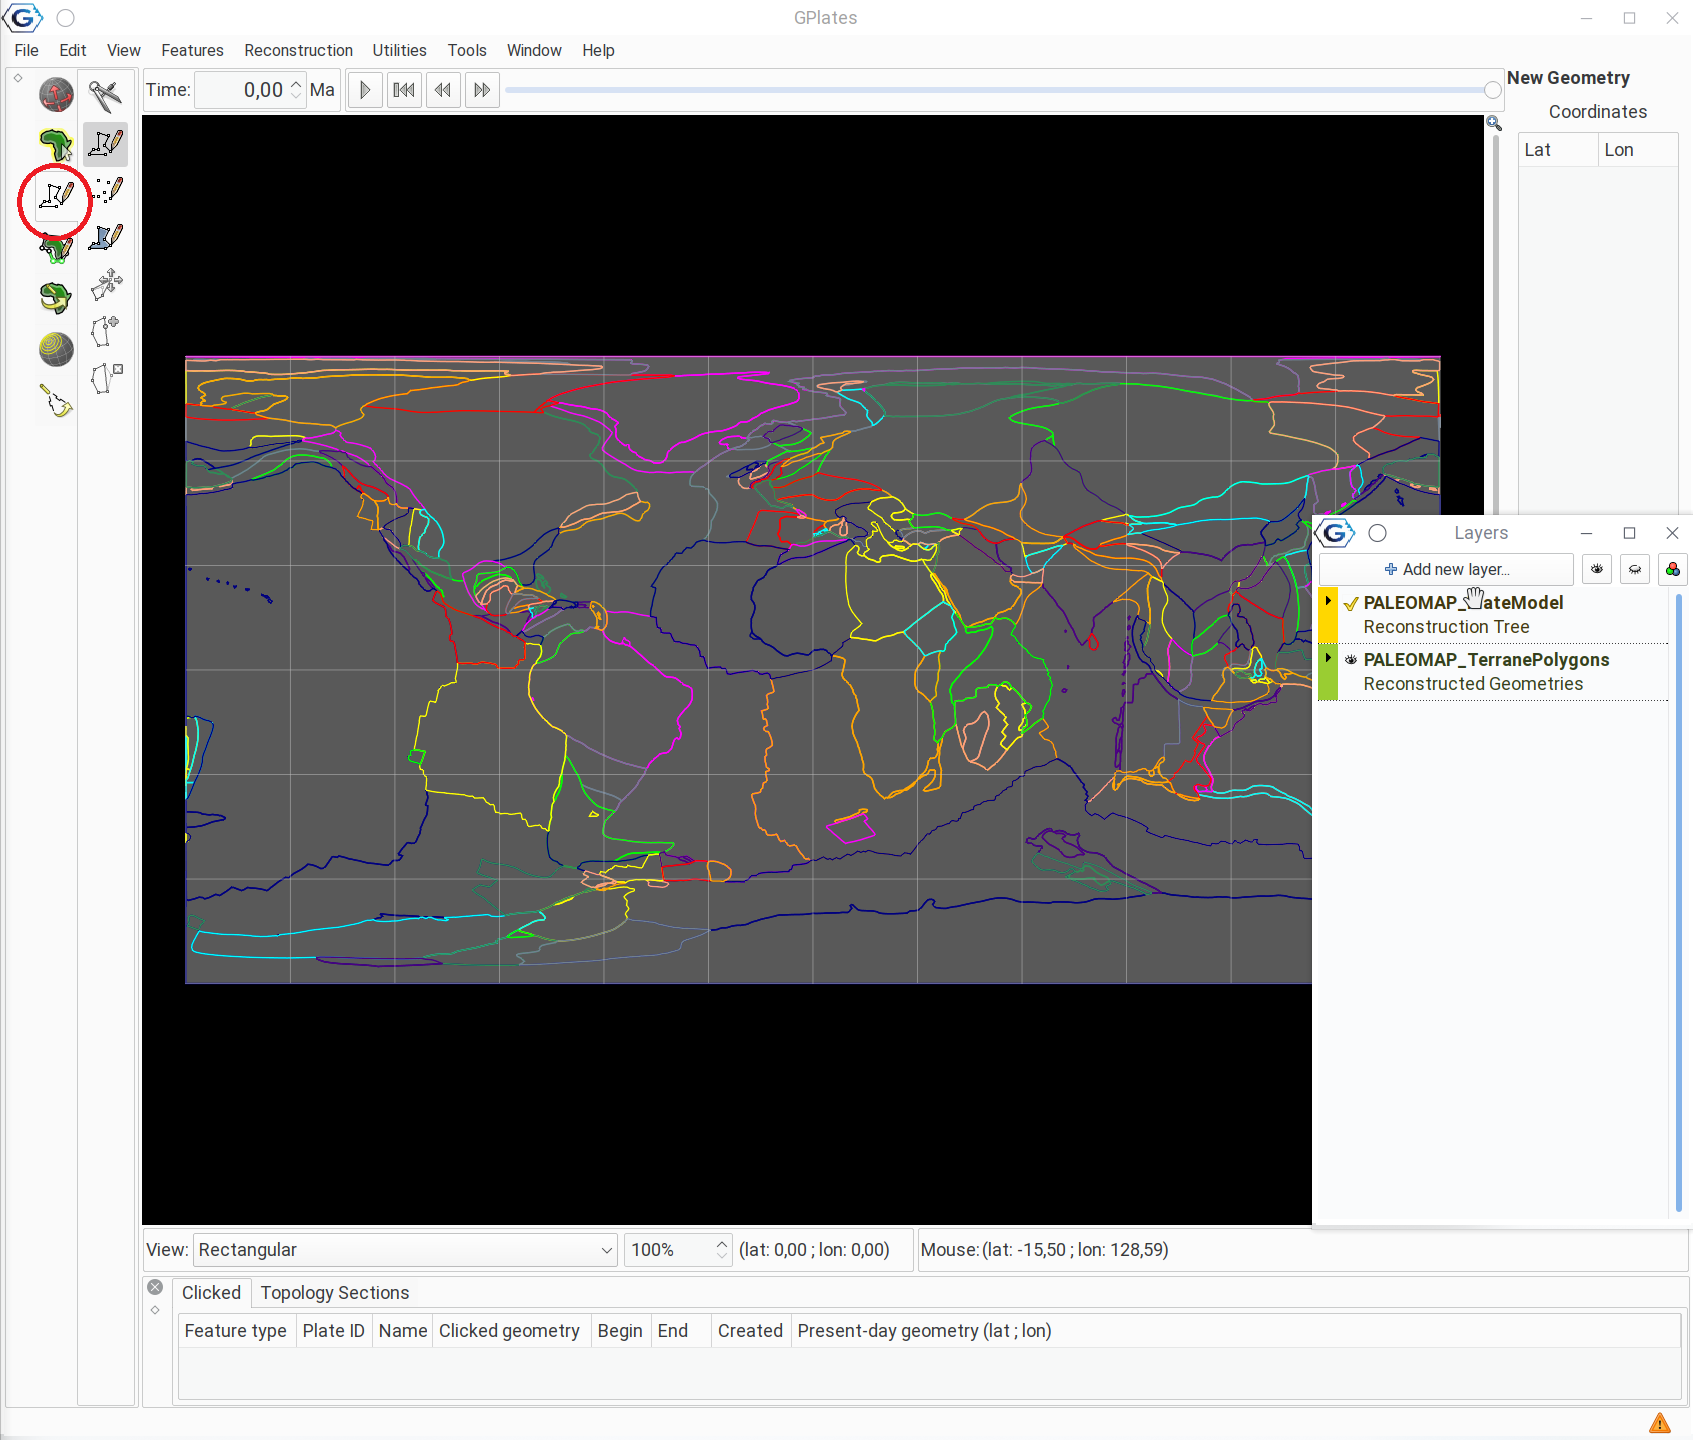
First, click on the Digitisation tool, on the left-hand side:
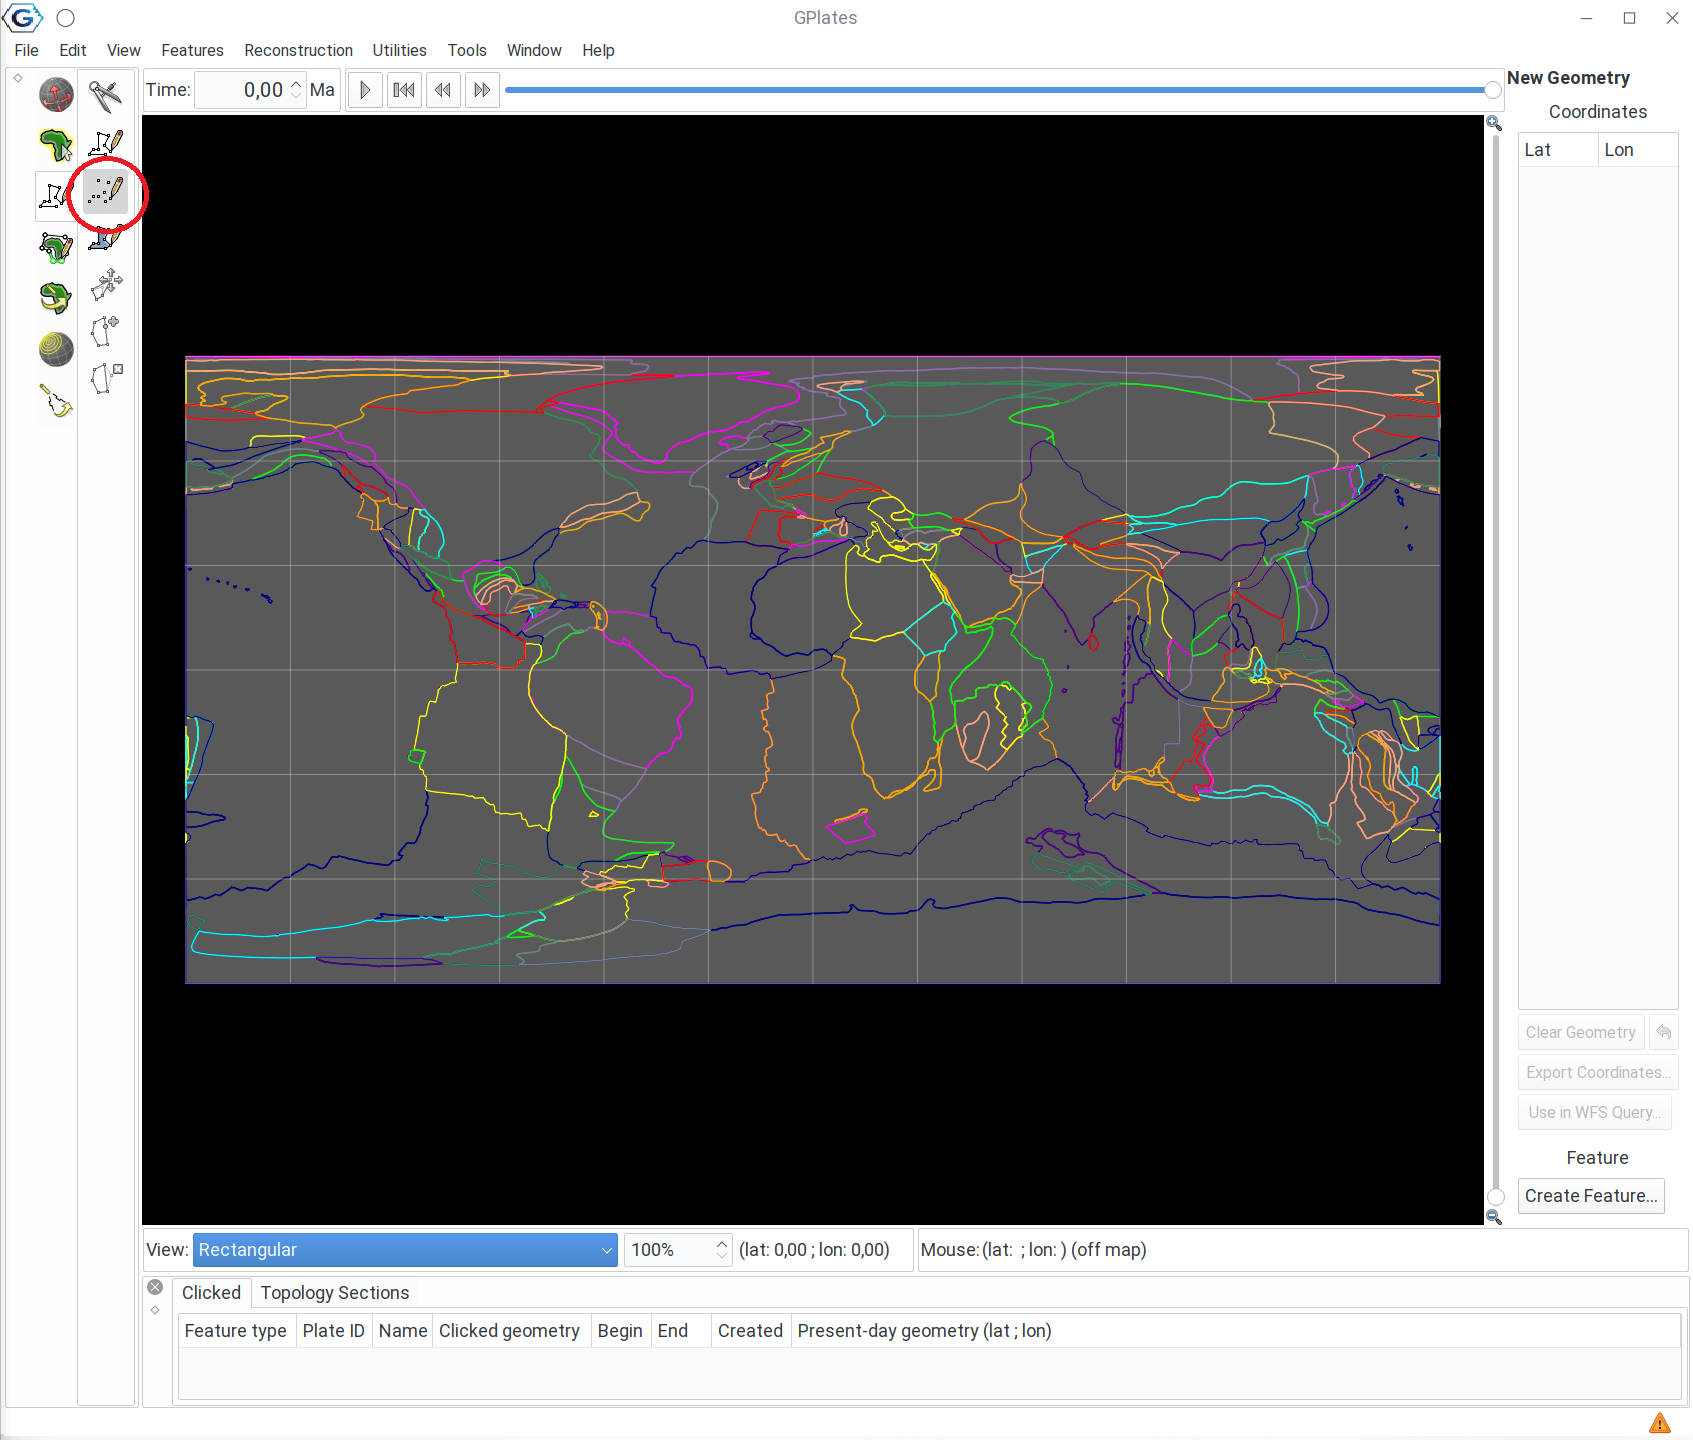
Then click on the Digitise New Multipoint Geometry tool:
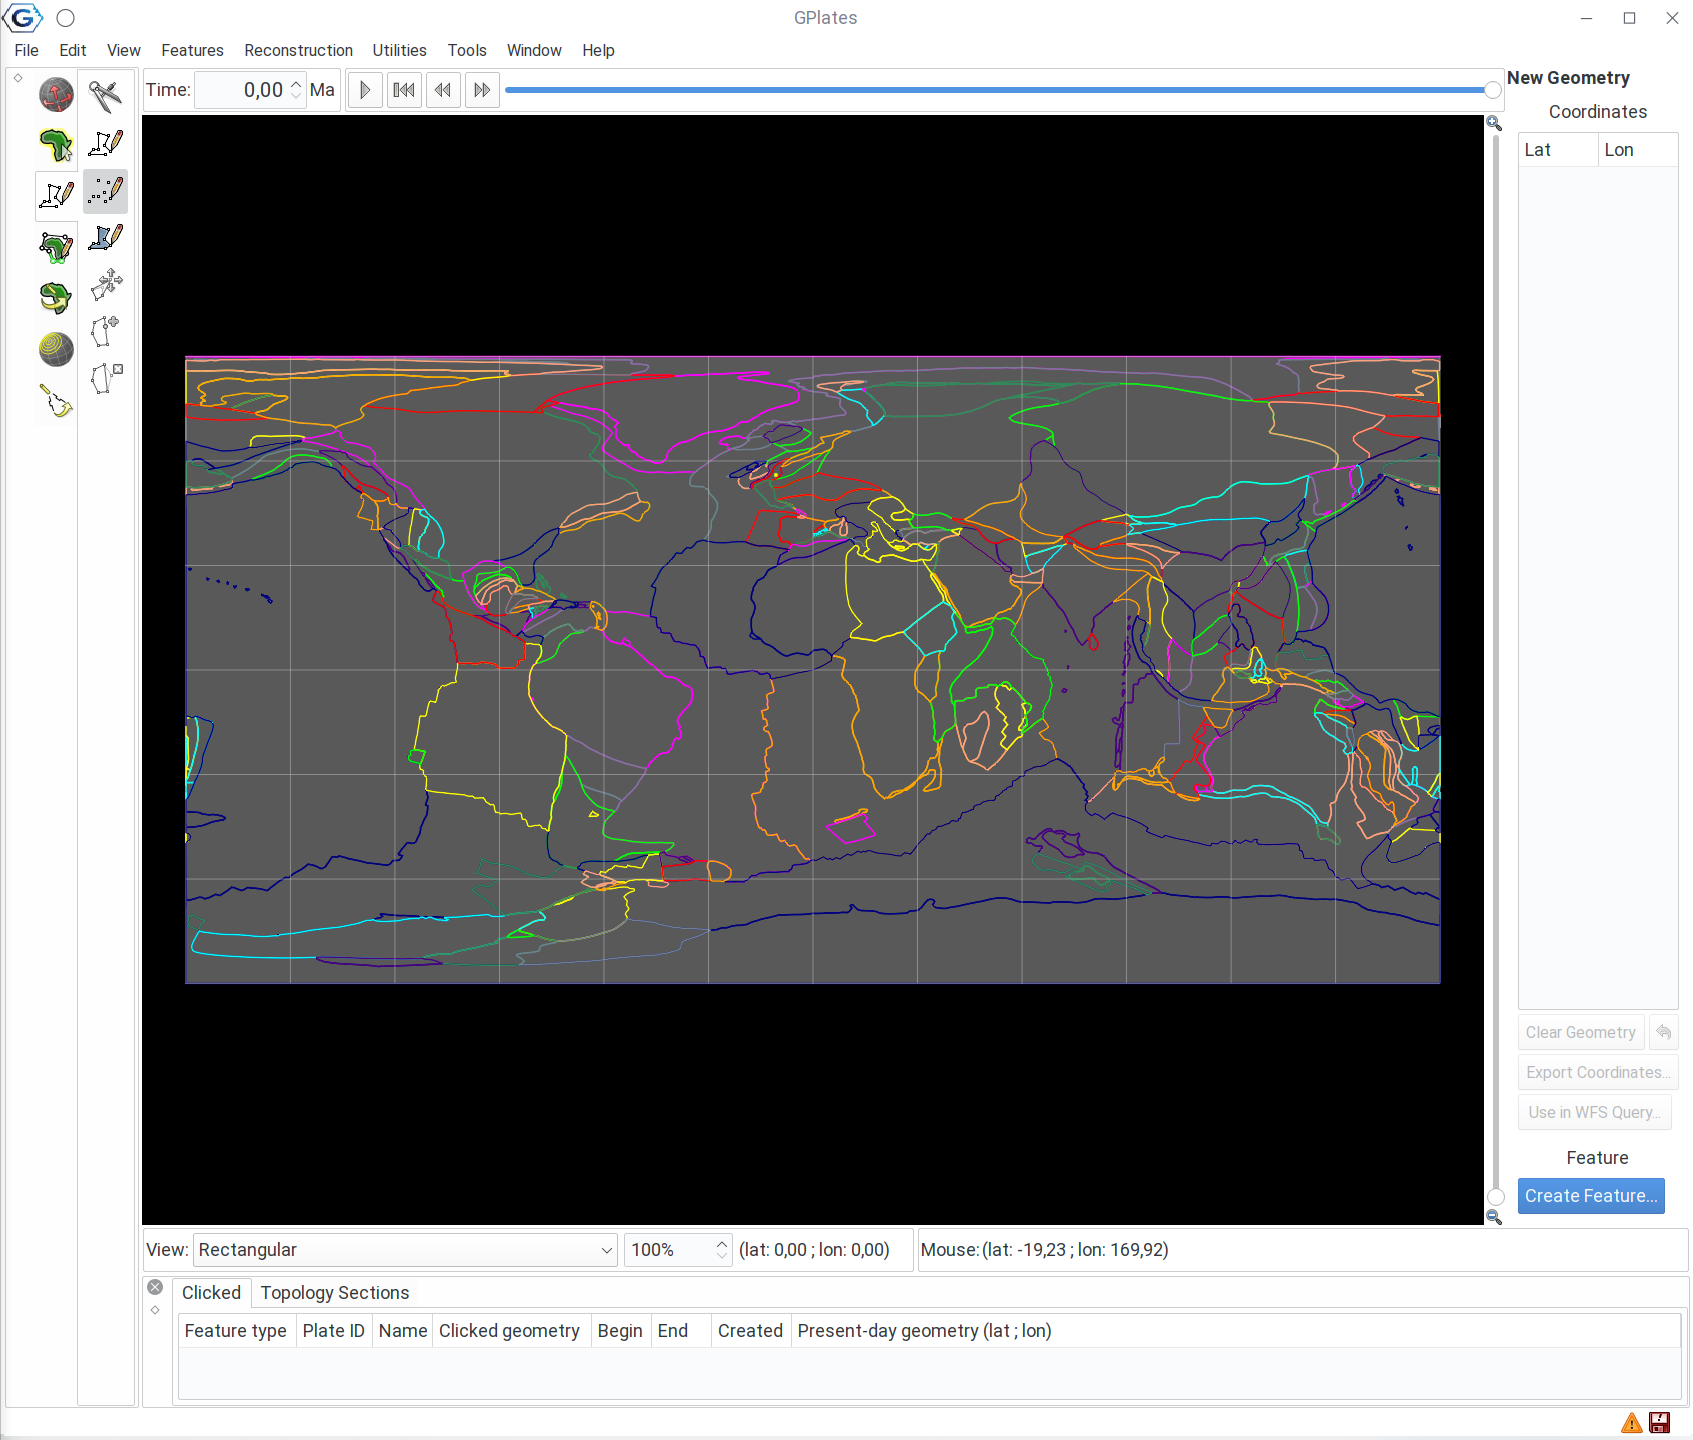
Now you can click anywhere on the map to add a point. Click somewhere around the approximate place of London:
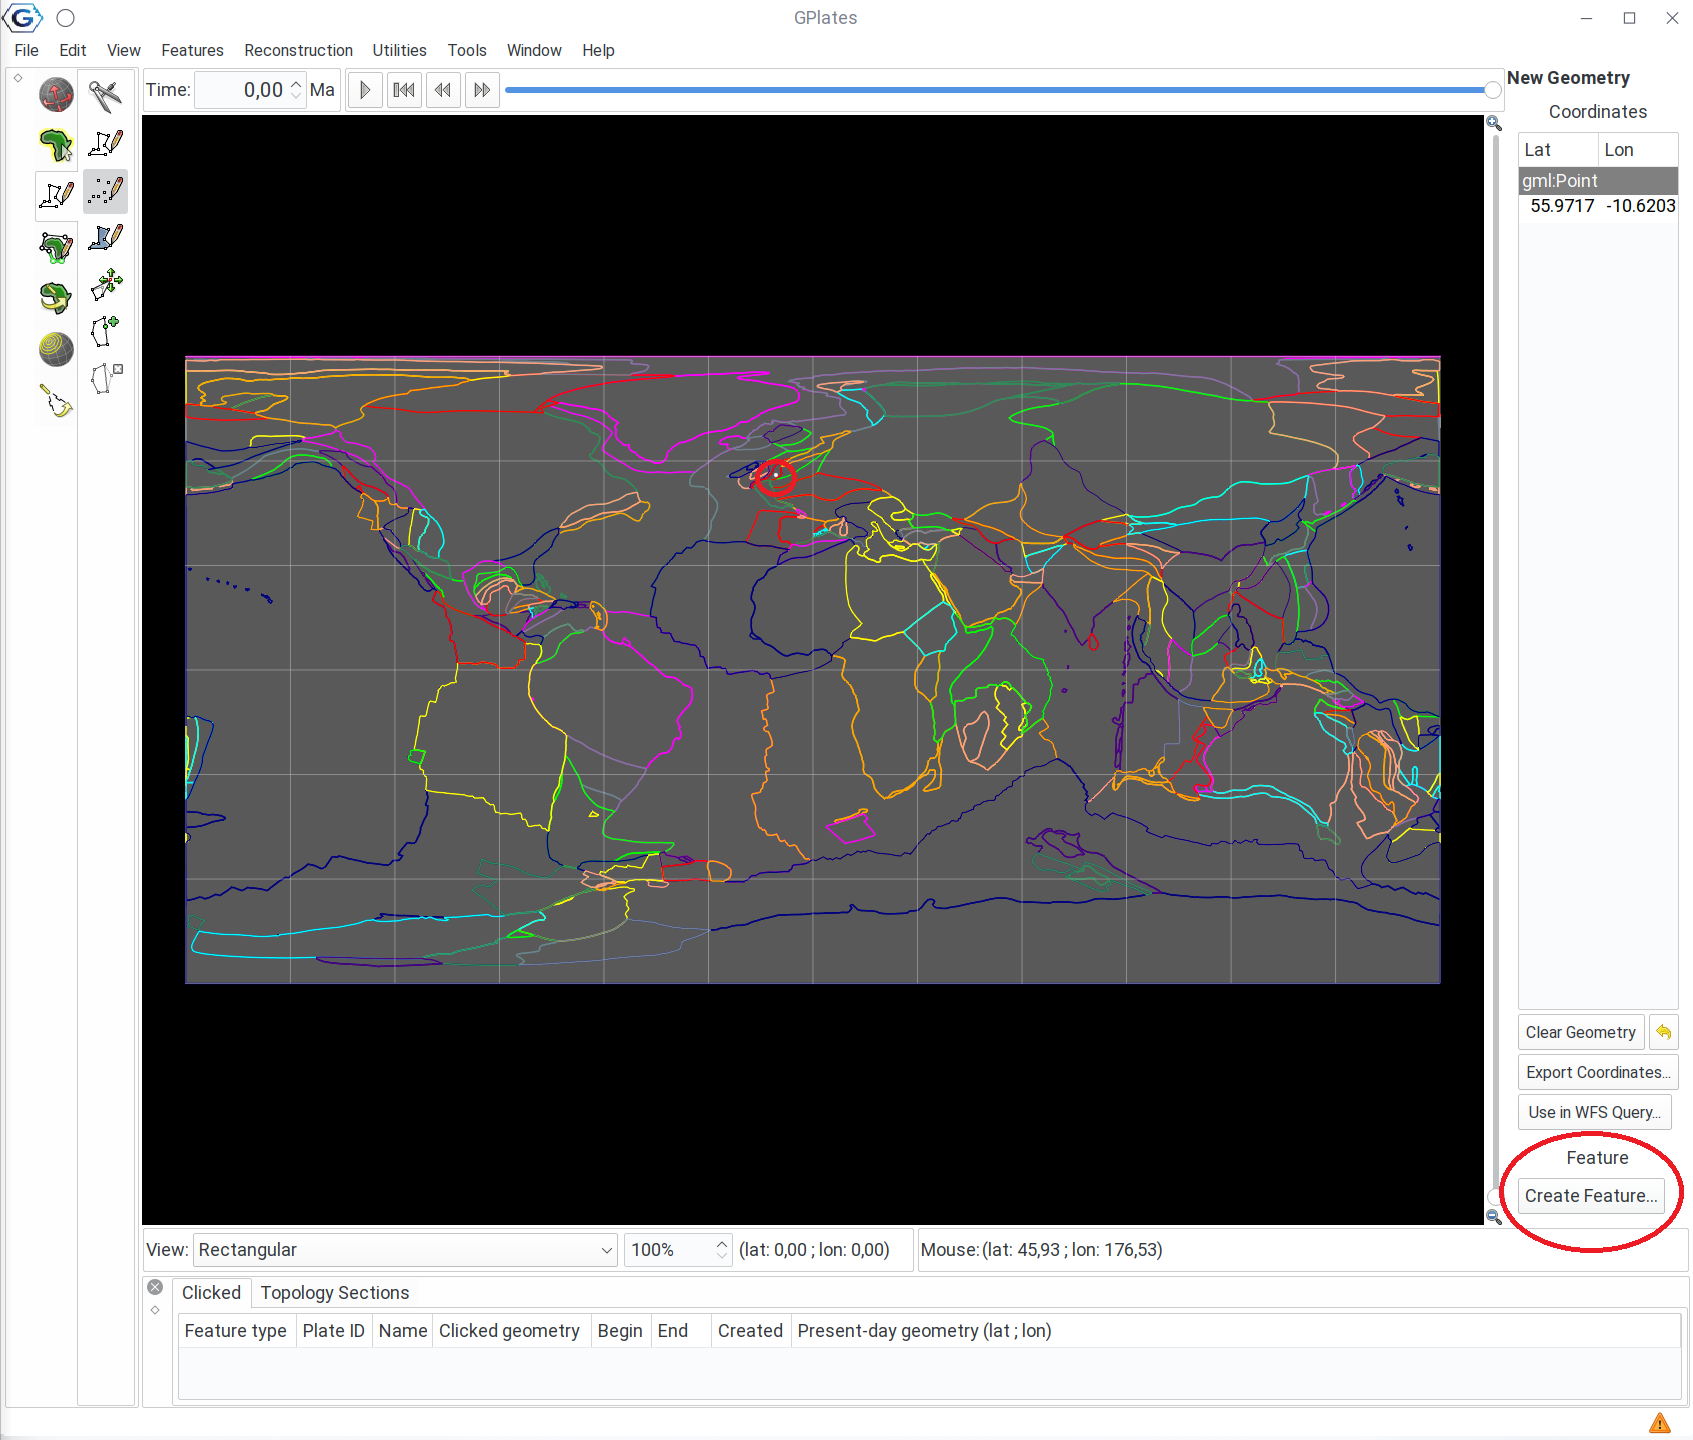
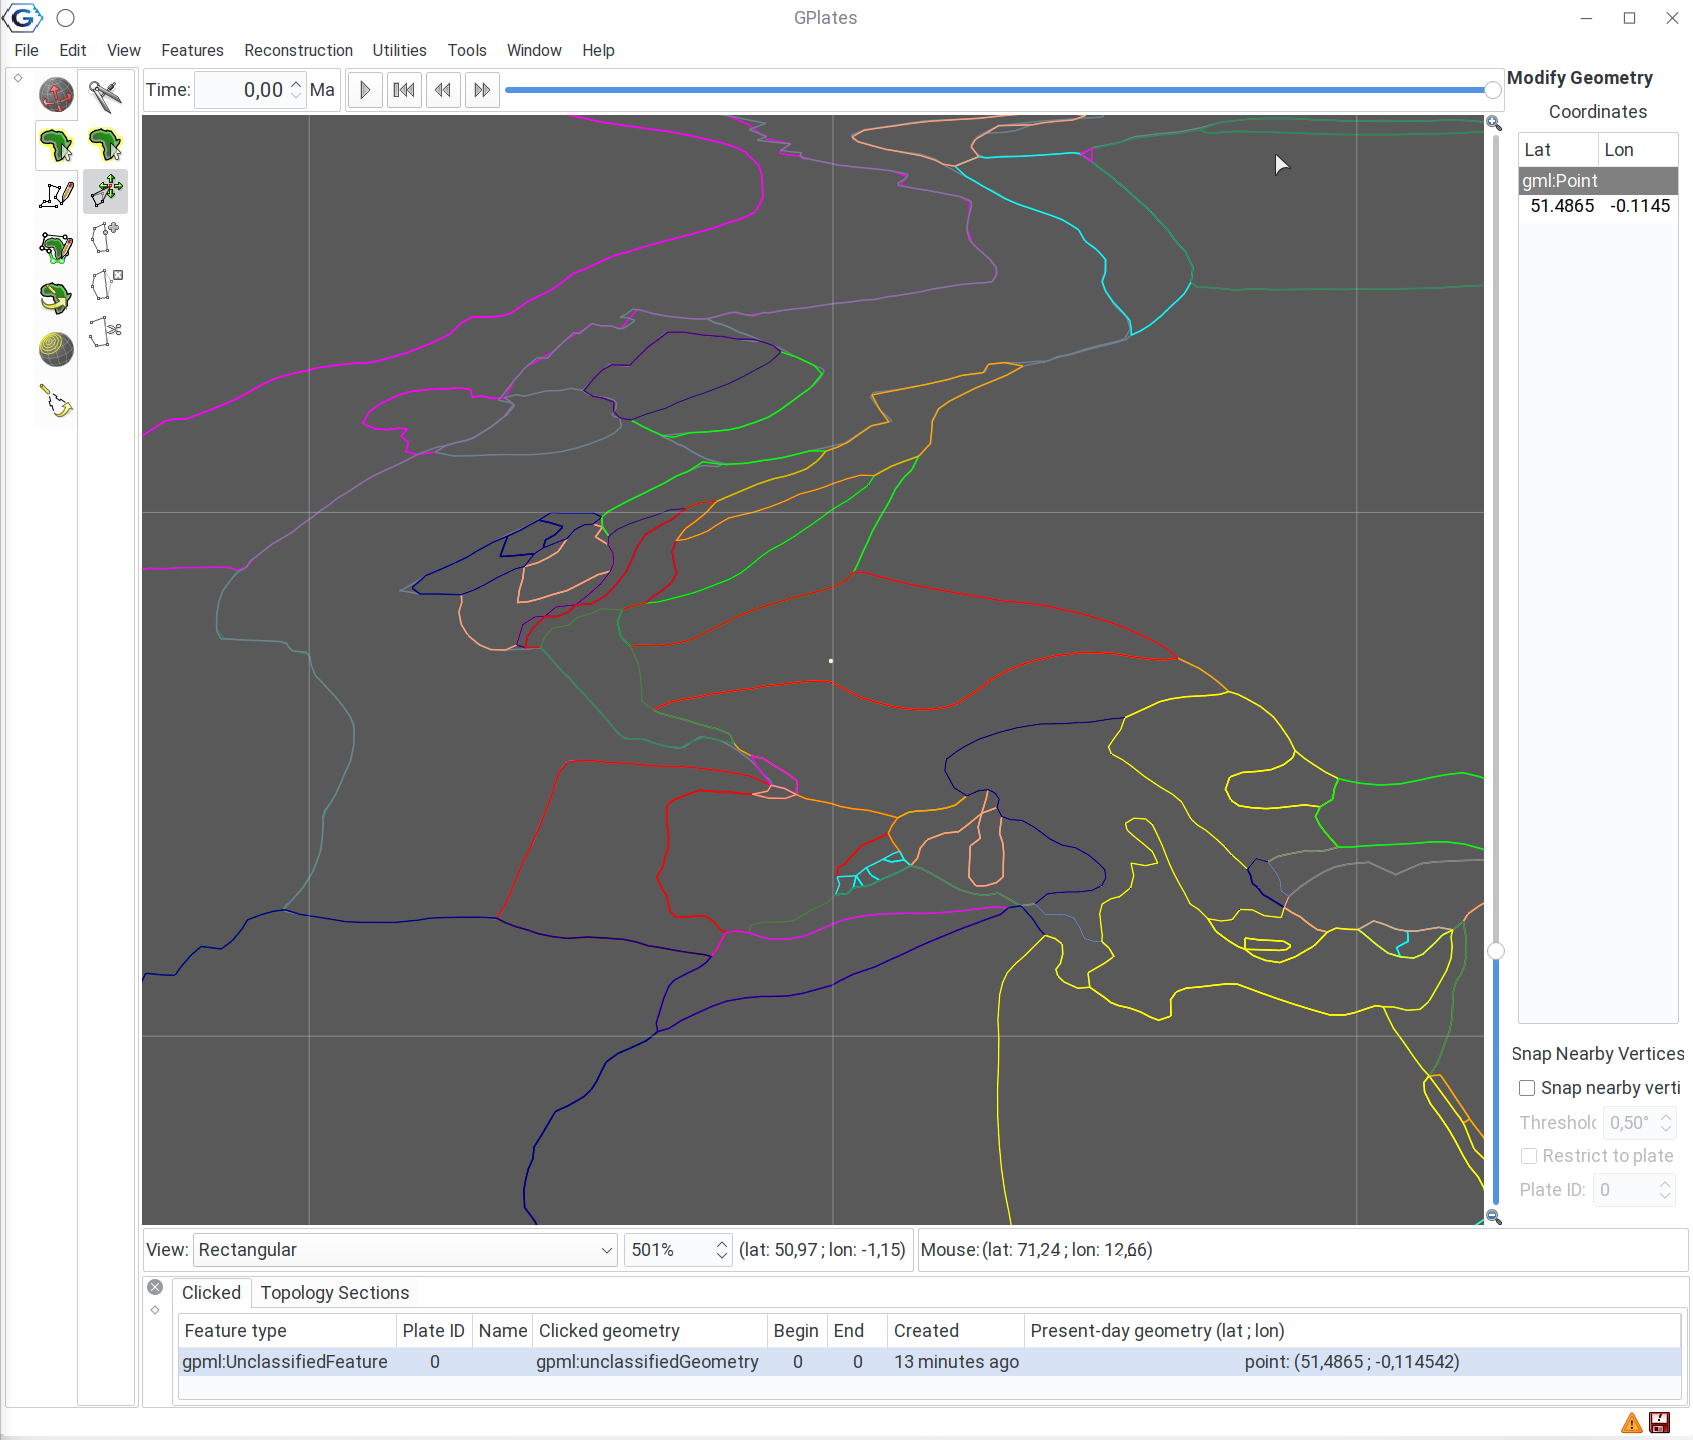
The point will appear on the map, and you will see the coordinates on the right-hand side pane. You can either discard this by clicking on the Clear Geometry button at the bottom, or you can create a new feature. You can also add more points (hence the name: multipoint), but that is not required now. Also don’t worry if the coordinates are not precise, we can change this later. Go on, and create a new feature:
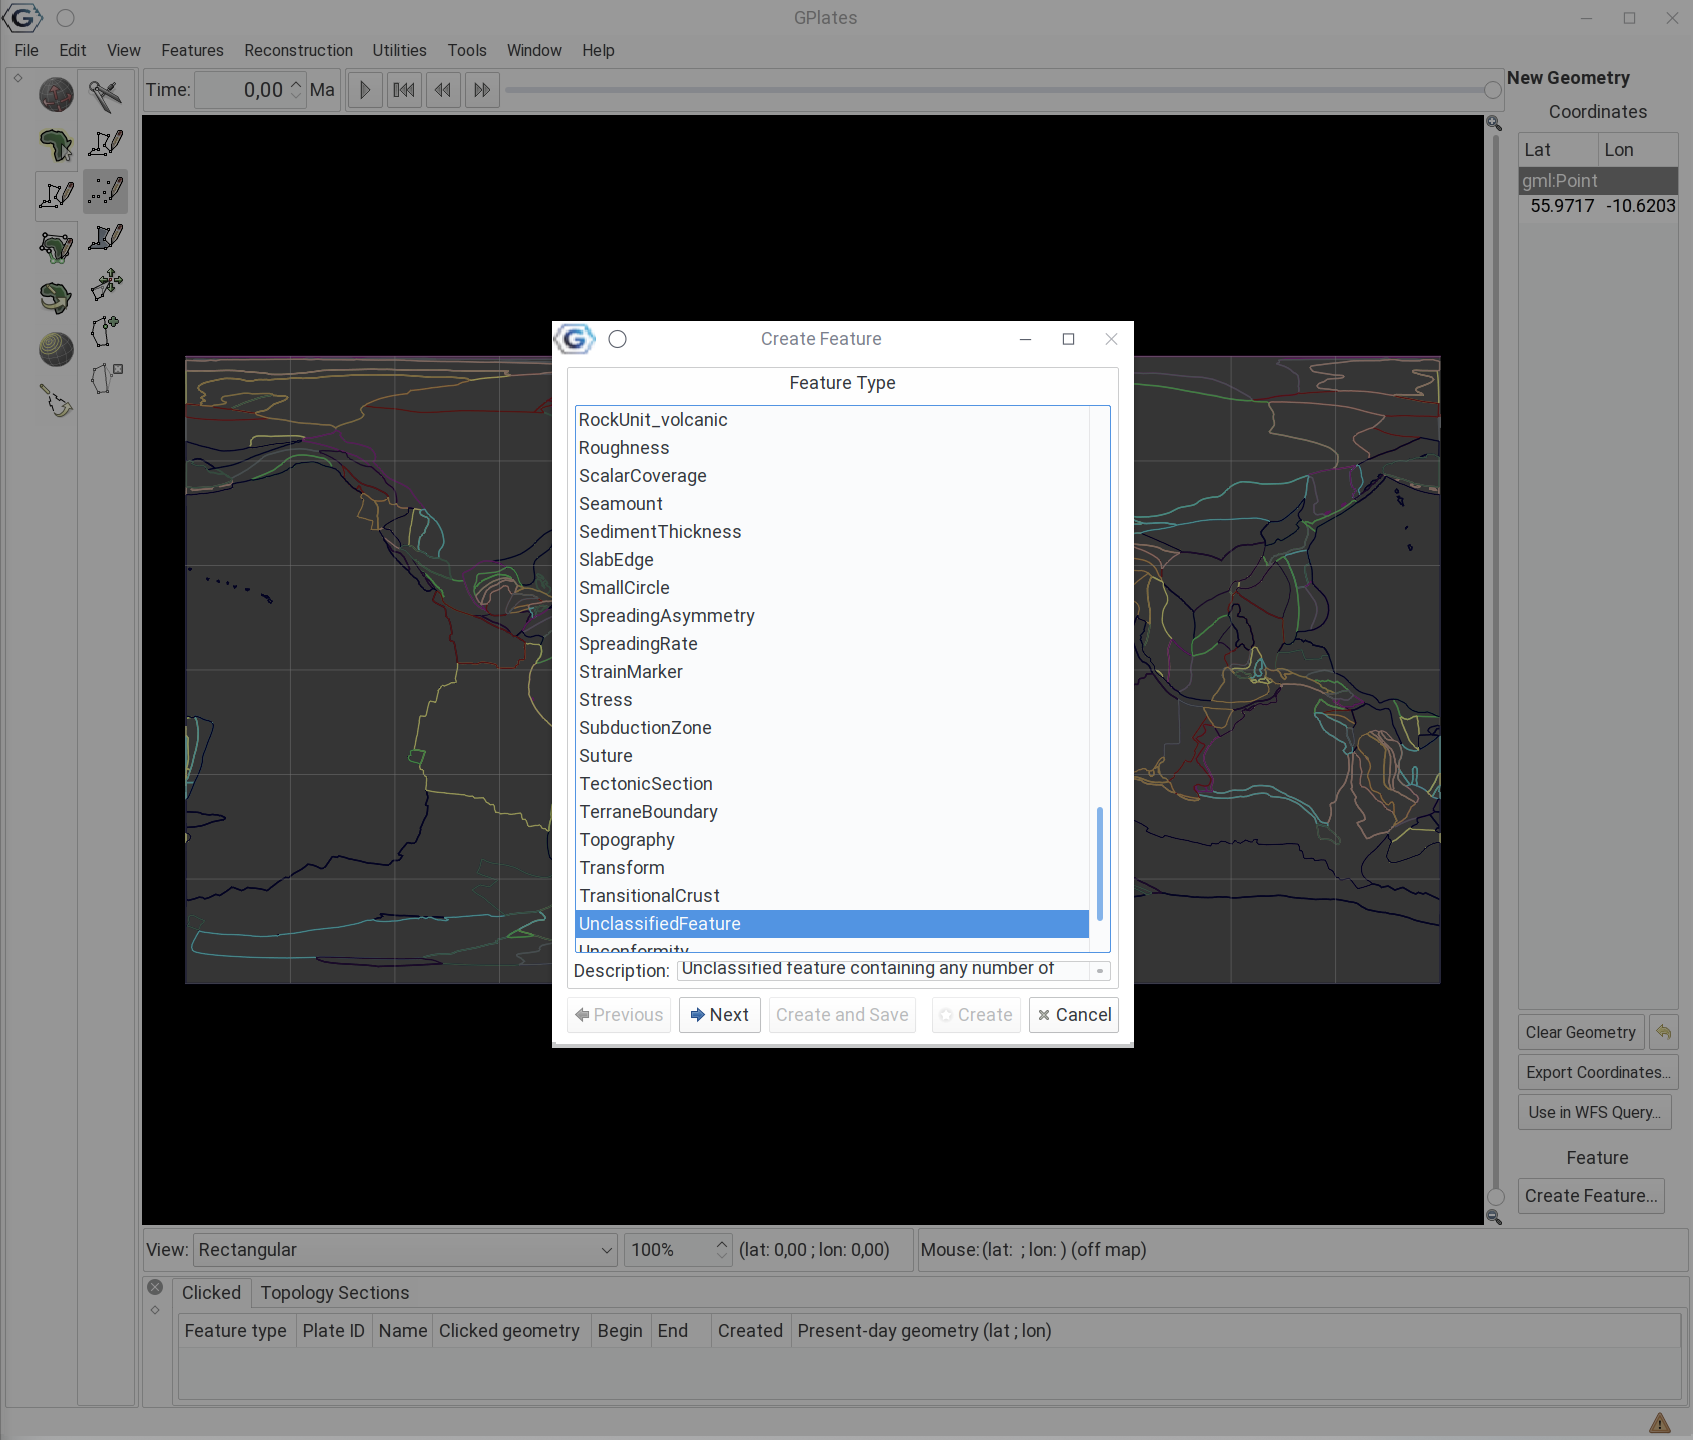
Now you can define what type of feature you want to create, what it was supposed to represent. This is not important, from what we want to achieve (it has more of a labelling function), so you can go with the UnclassifiedFeature option, and click on Next!
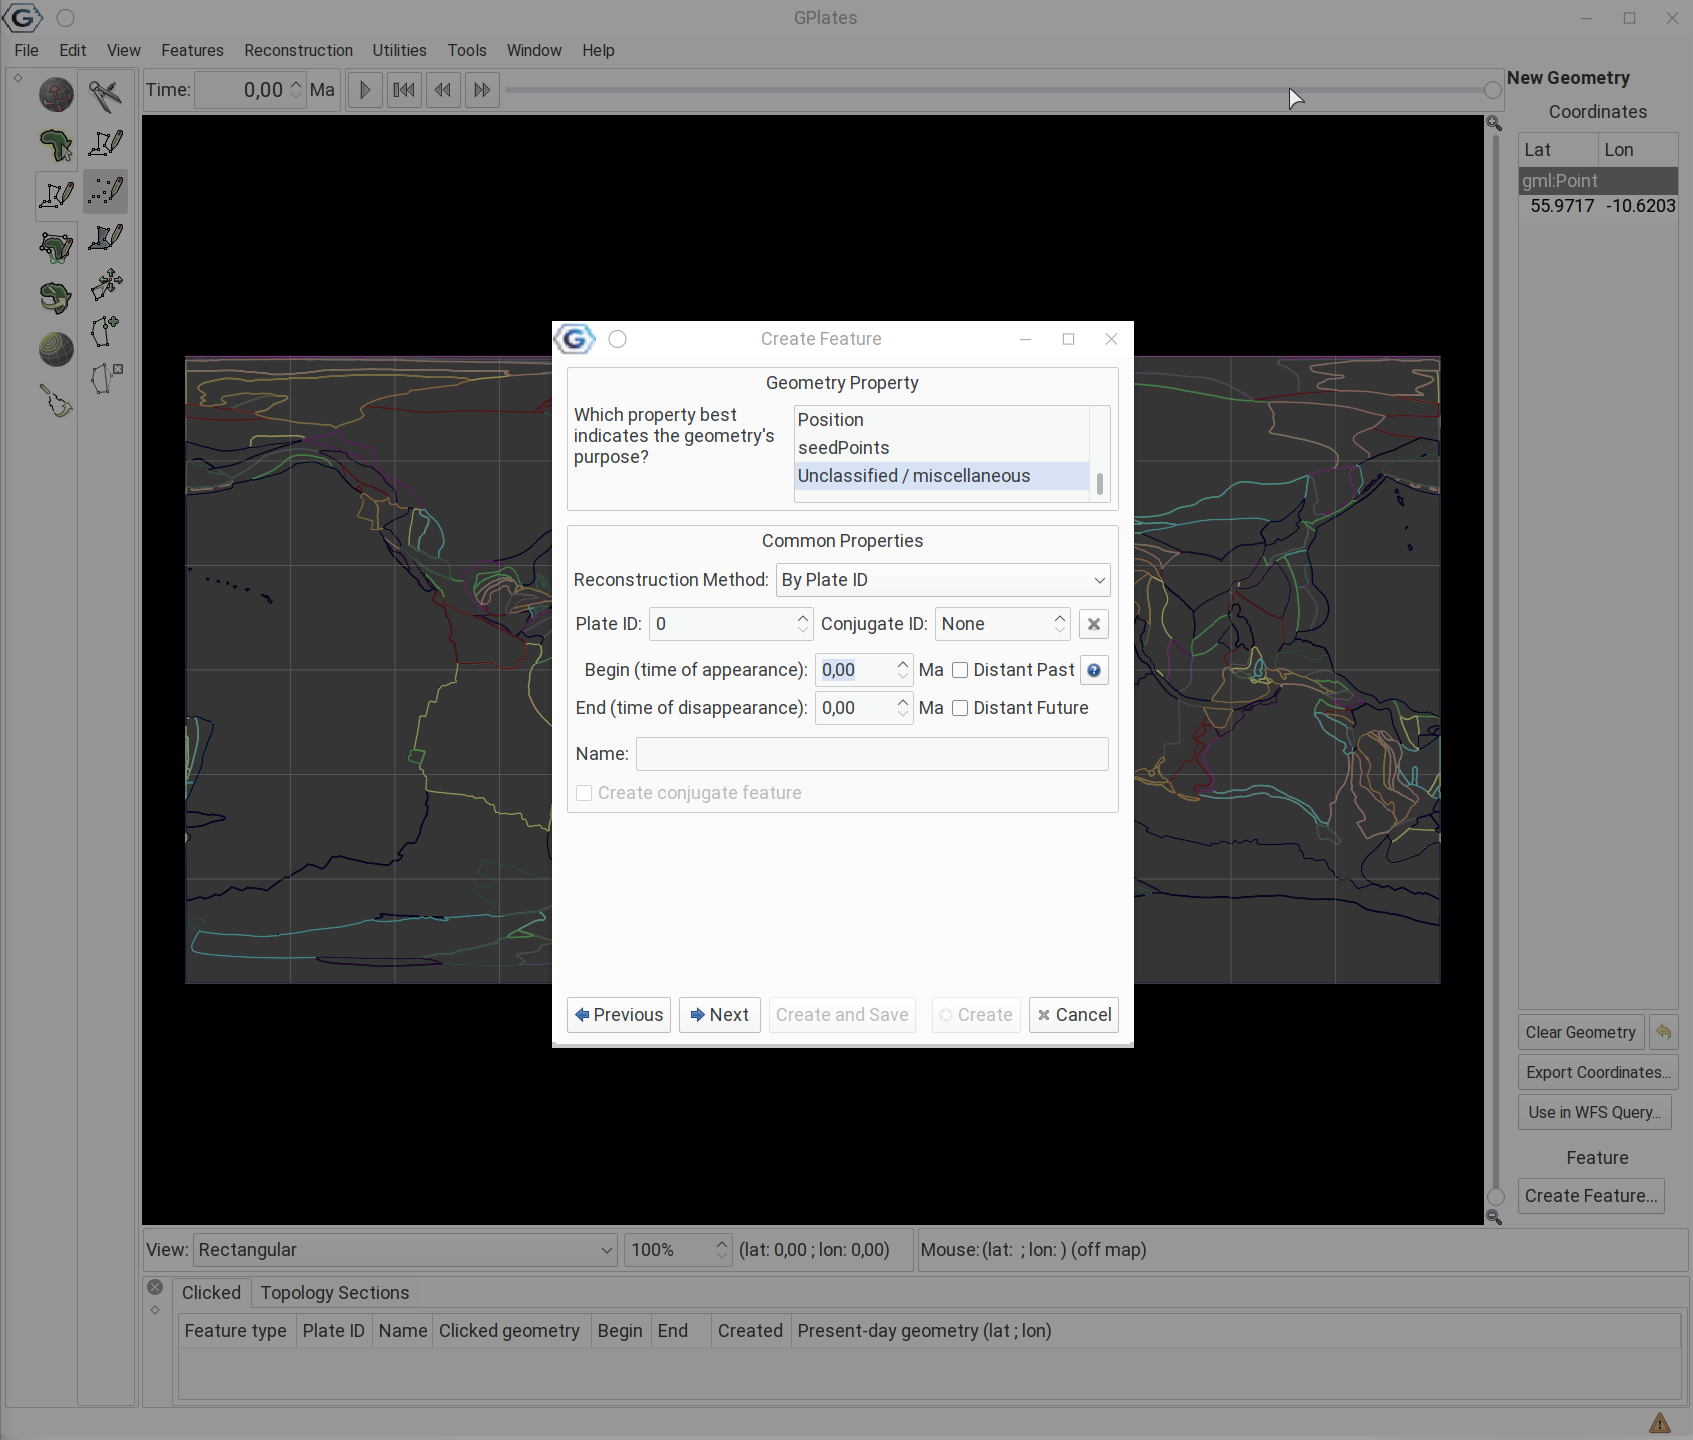
Here you can already set some of the attributes of the newly created feature: the PlateID where it belongs, and begin and end time. This we will change later, you can click on Next!
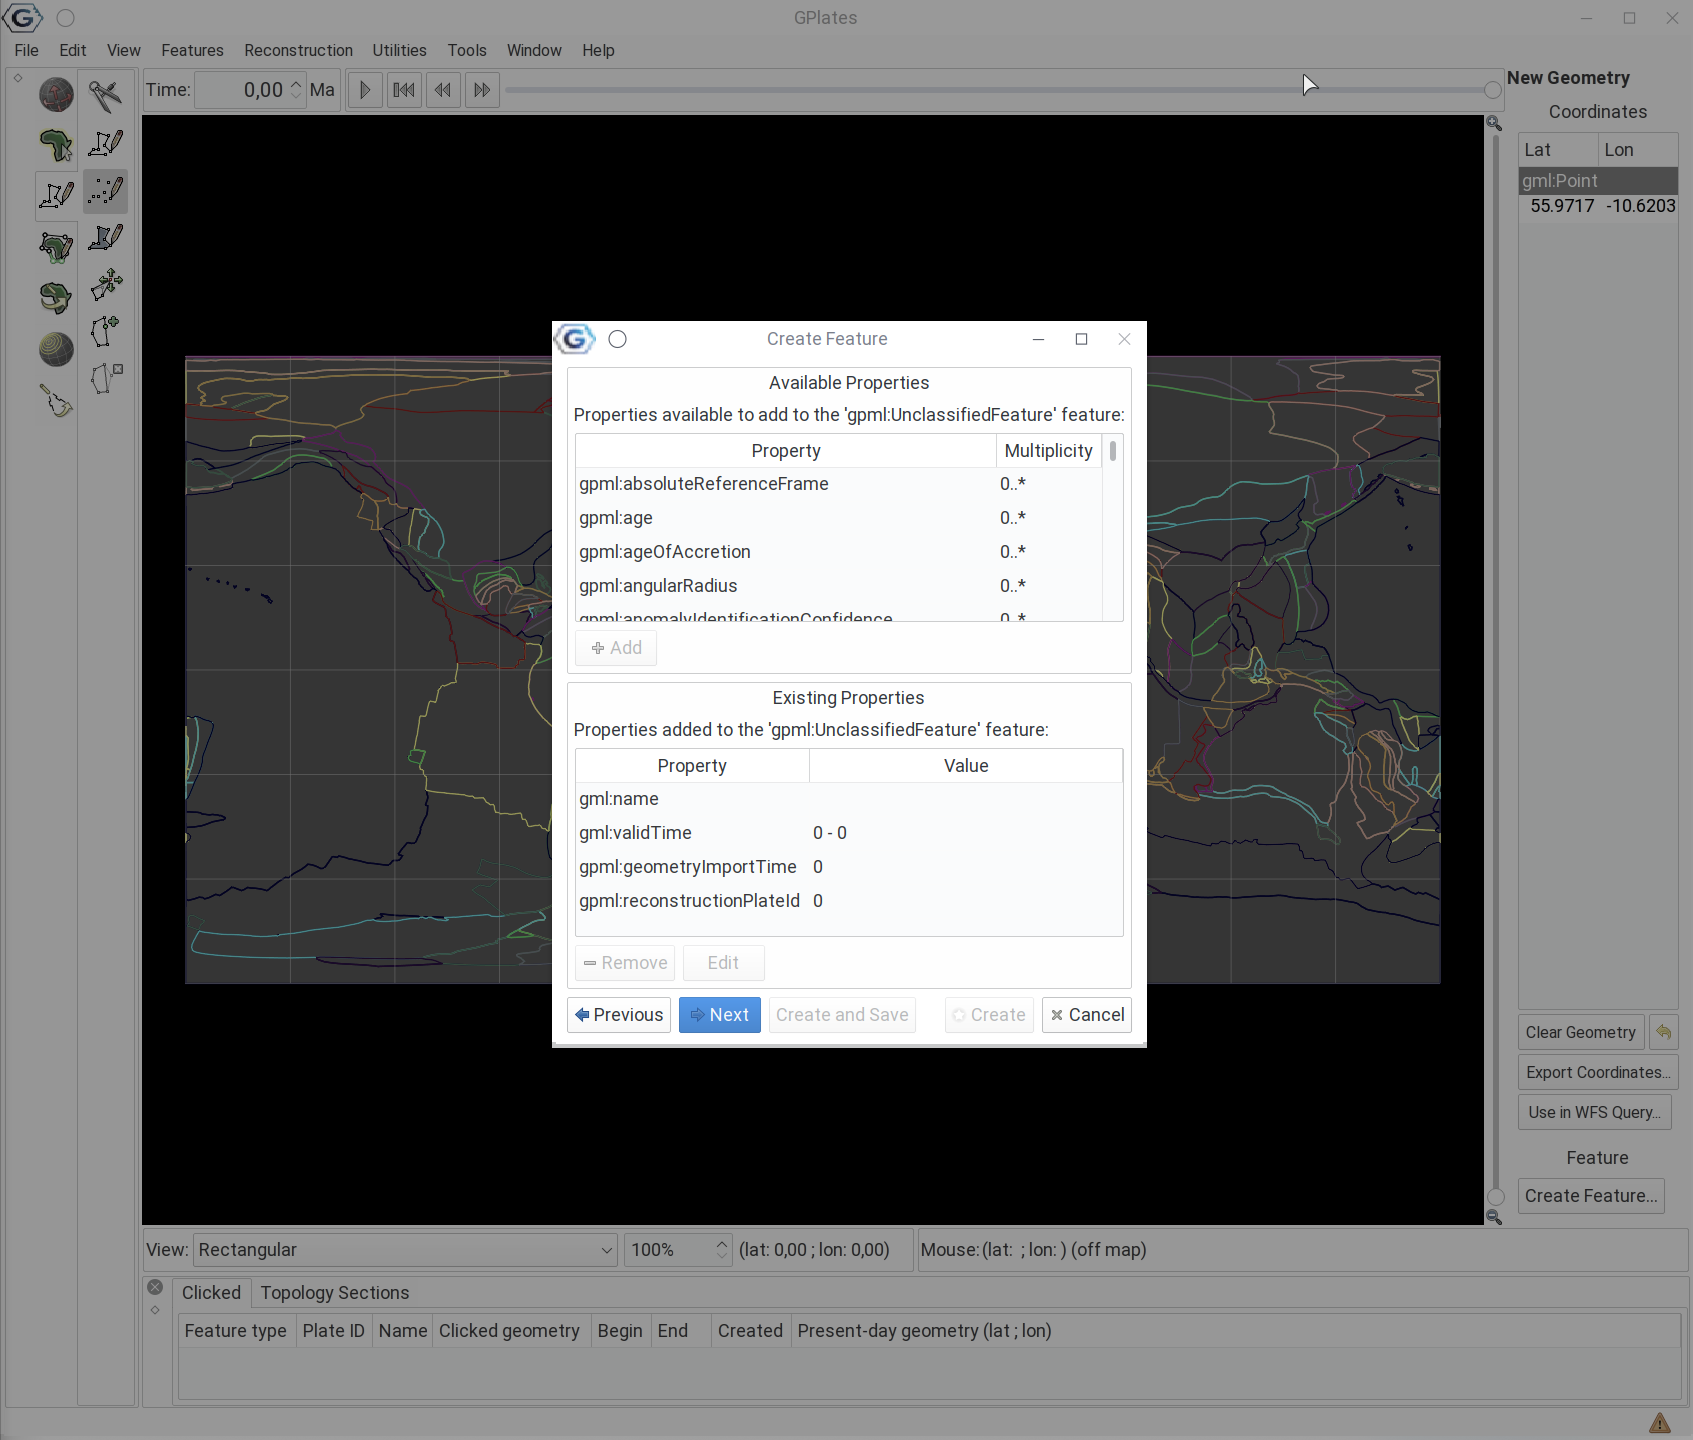
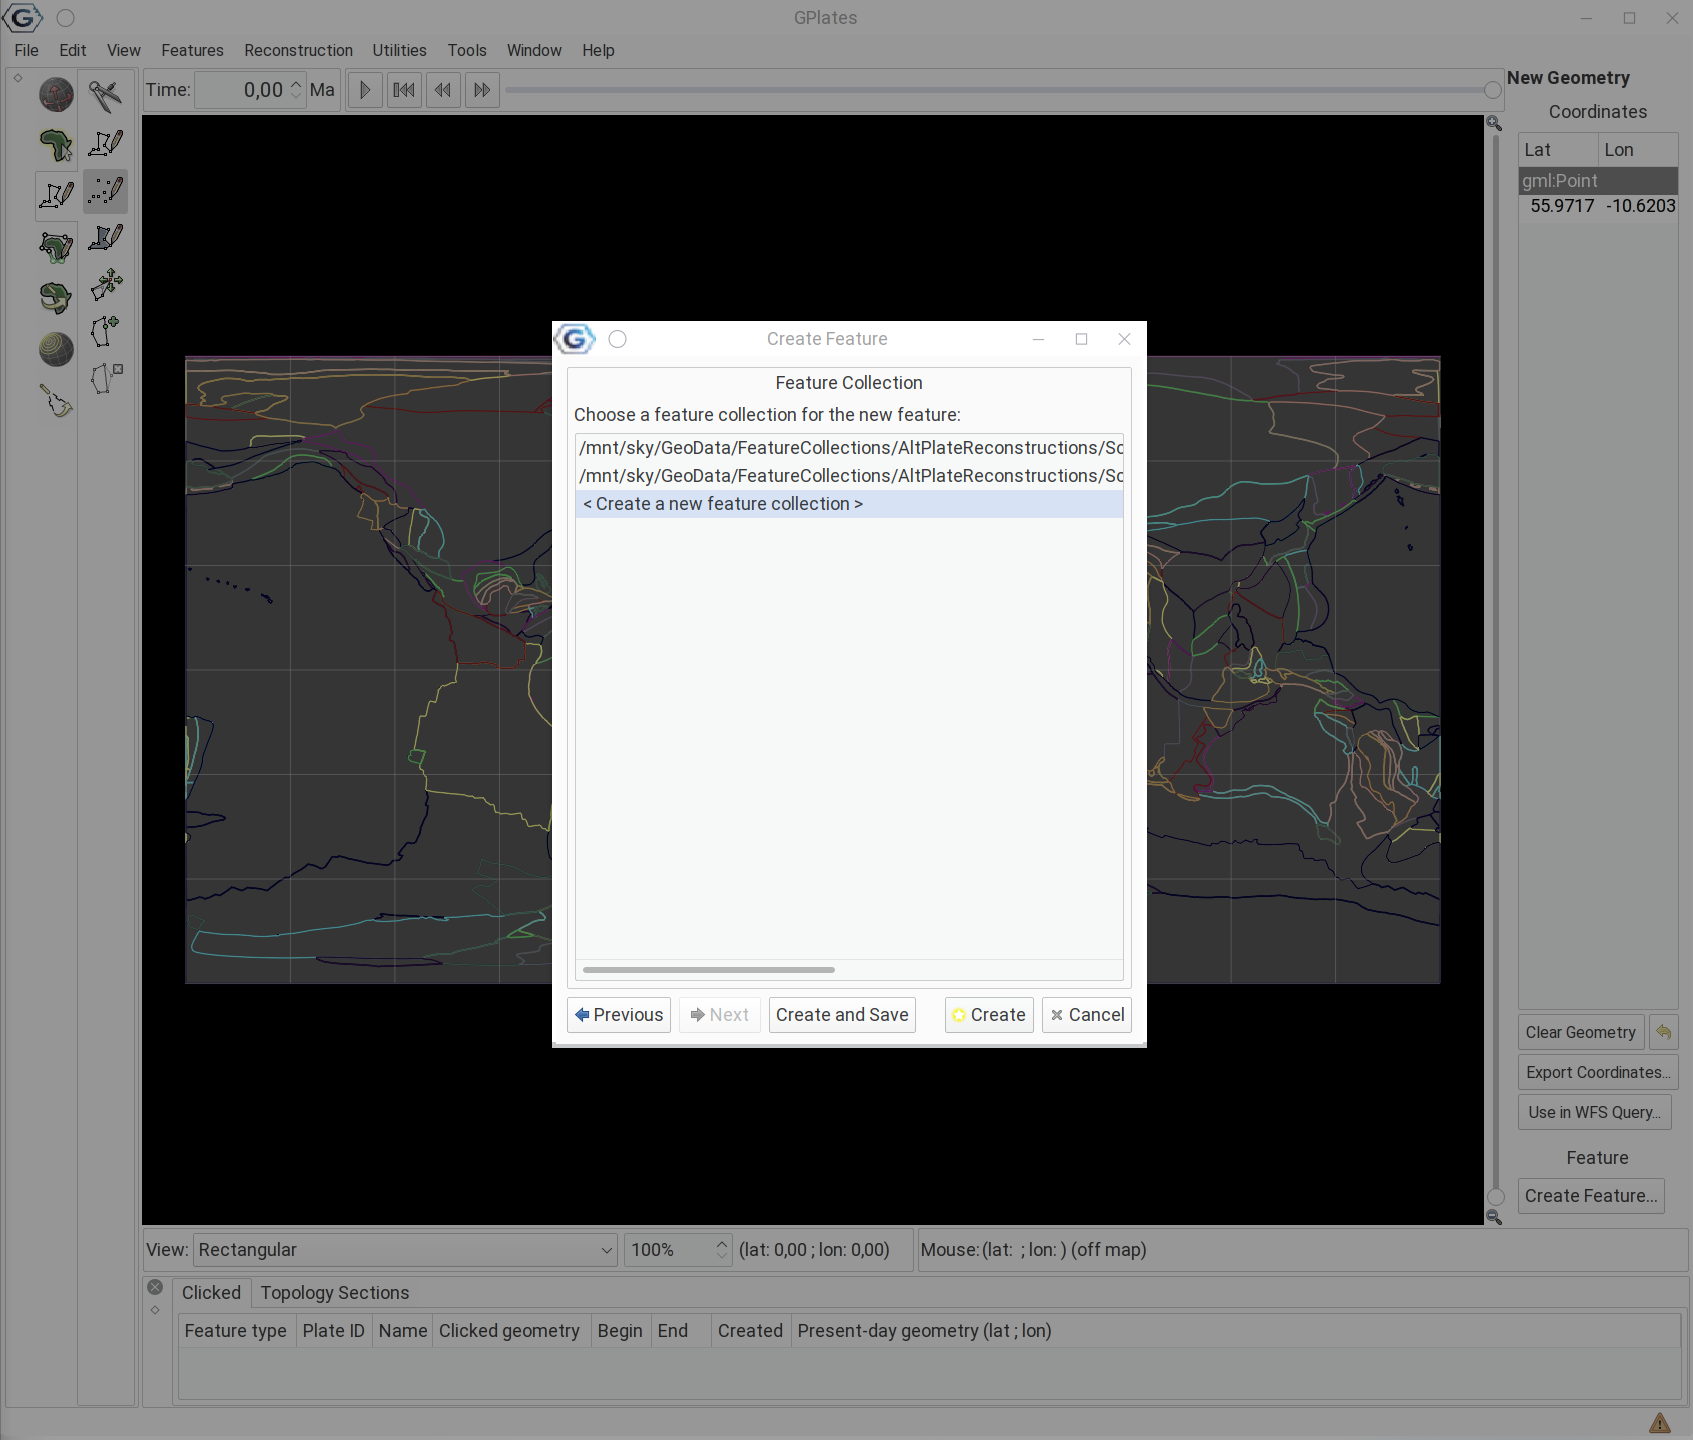
… and also on the next window. Then you have the option of adding the new feature to a feature collection. Create a new feature collection by clicking on Create!
After this step, you should still see the new point.
Editing the feature
First, select the Feature Inspection tool on the left-hand side, and click on the point you have created (you can also zoom in, if you like).
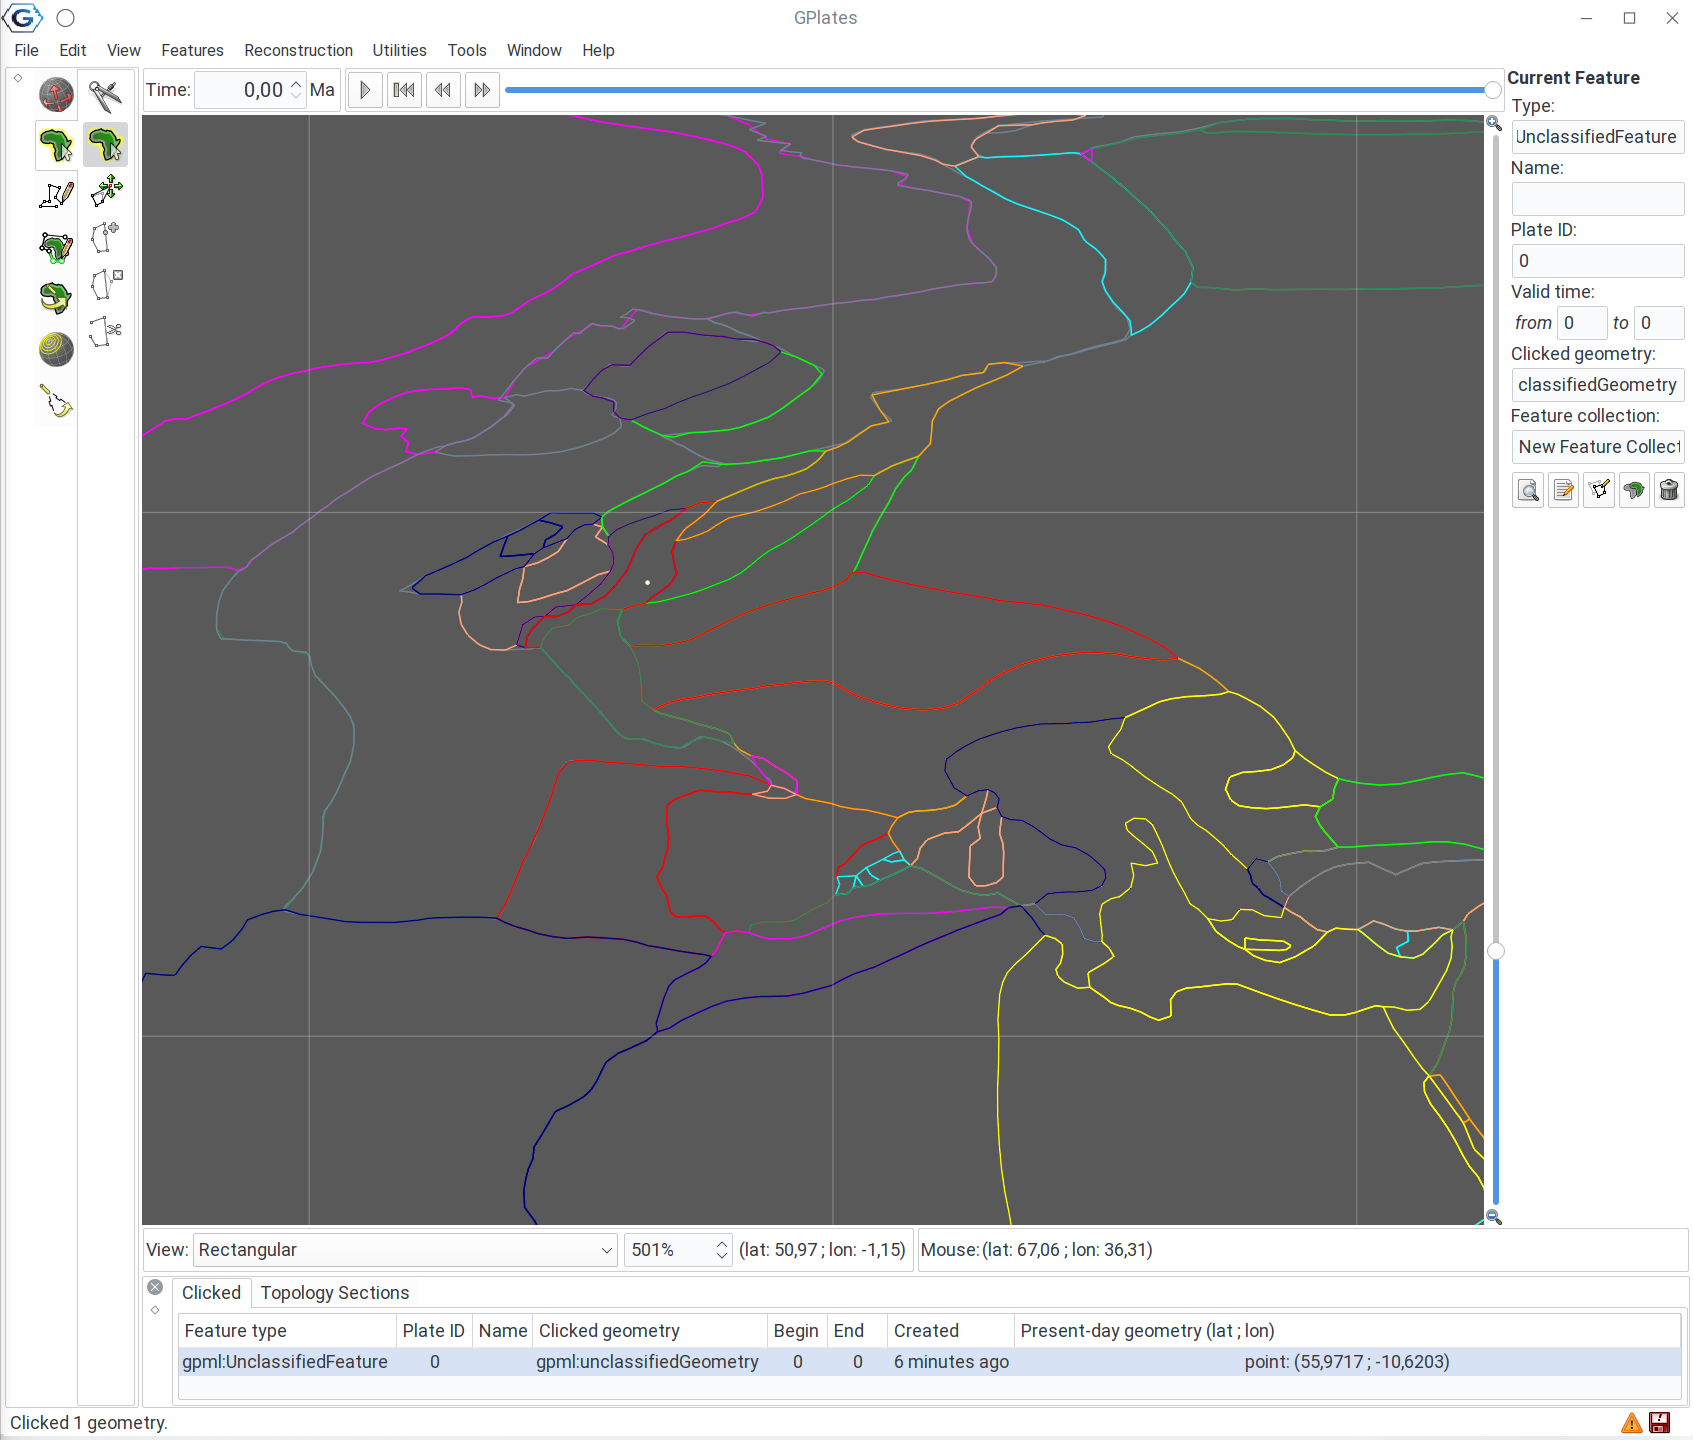
You can see that the point has a plate ID of 0, and it does not have a valid time.
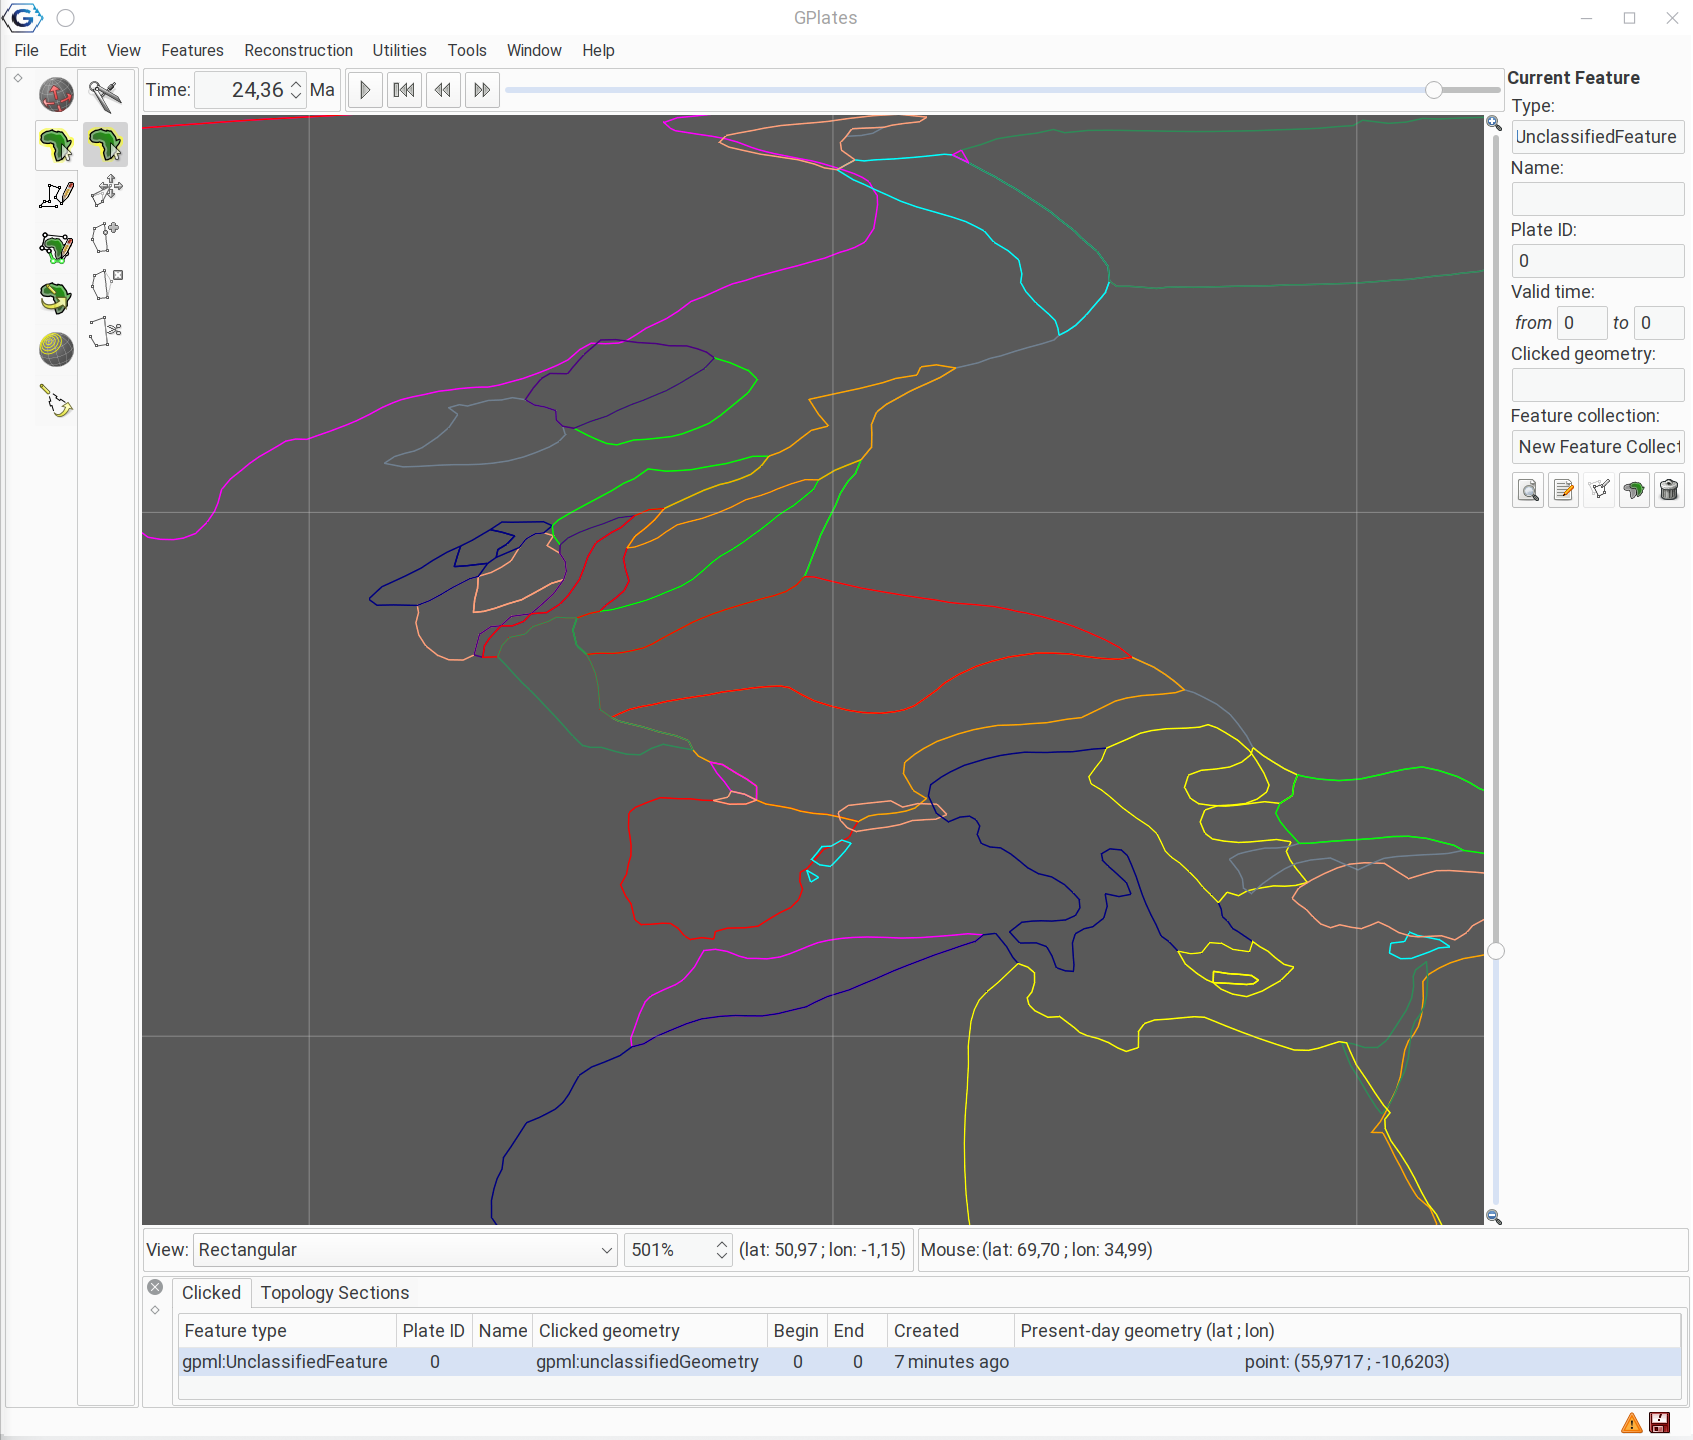
If you try to move the time slider, to see where the point was in the past, you will see that it does not move, as a matter of fact, it will disappear (because of the from and to dates):
To alter this, we have to change the from and to dates and the Plate ID, for that we have to figure out the Plate ID of the plate where London is sitting - and for that we need the appropriate position. To fine tune the position of the point, use the Move Vertex tool:
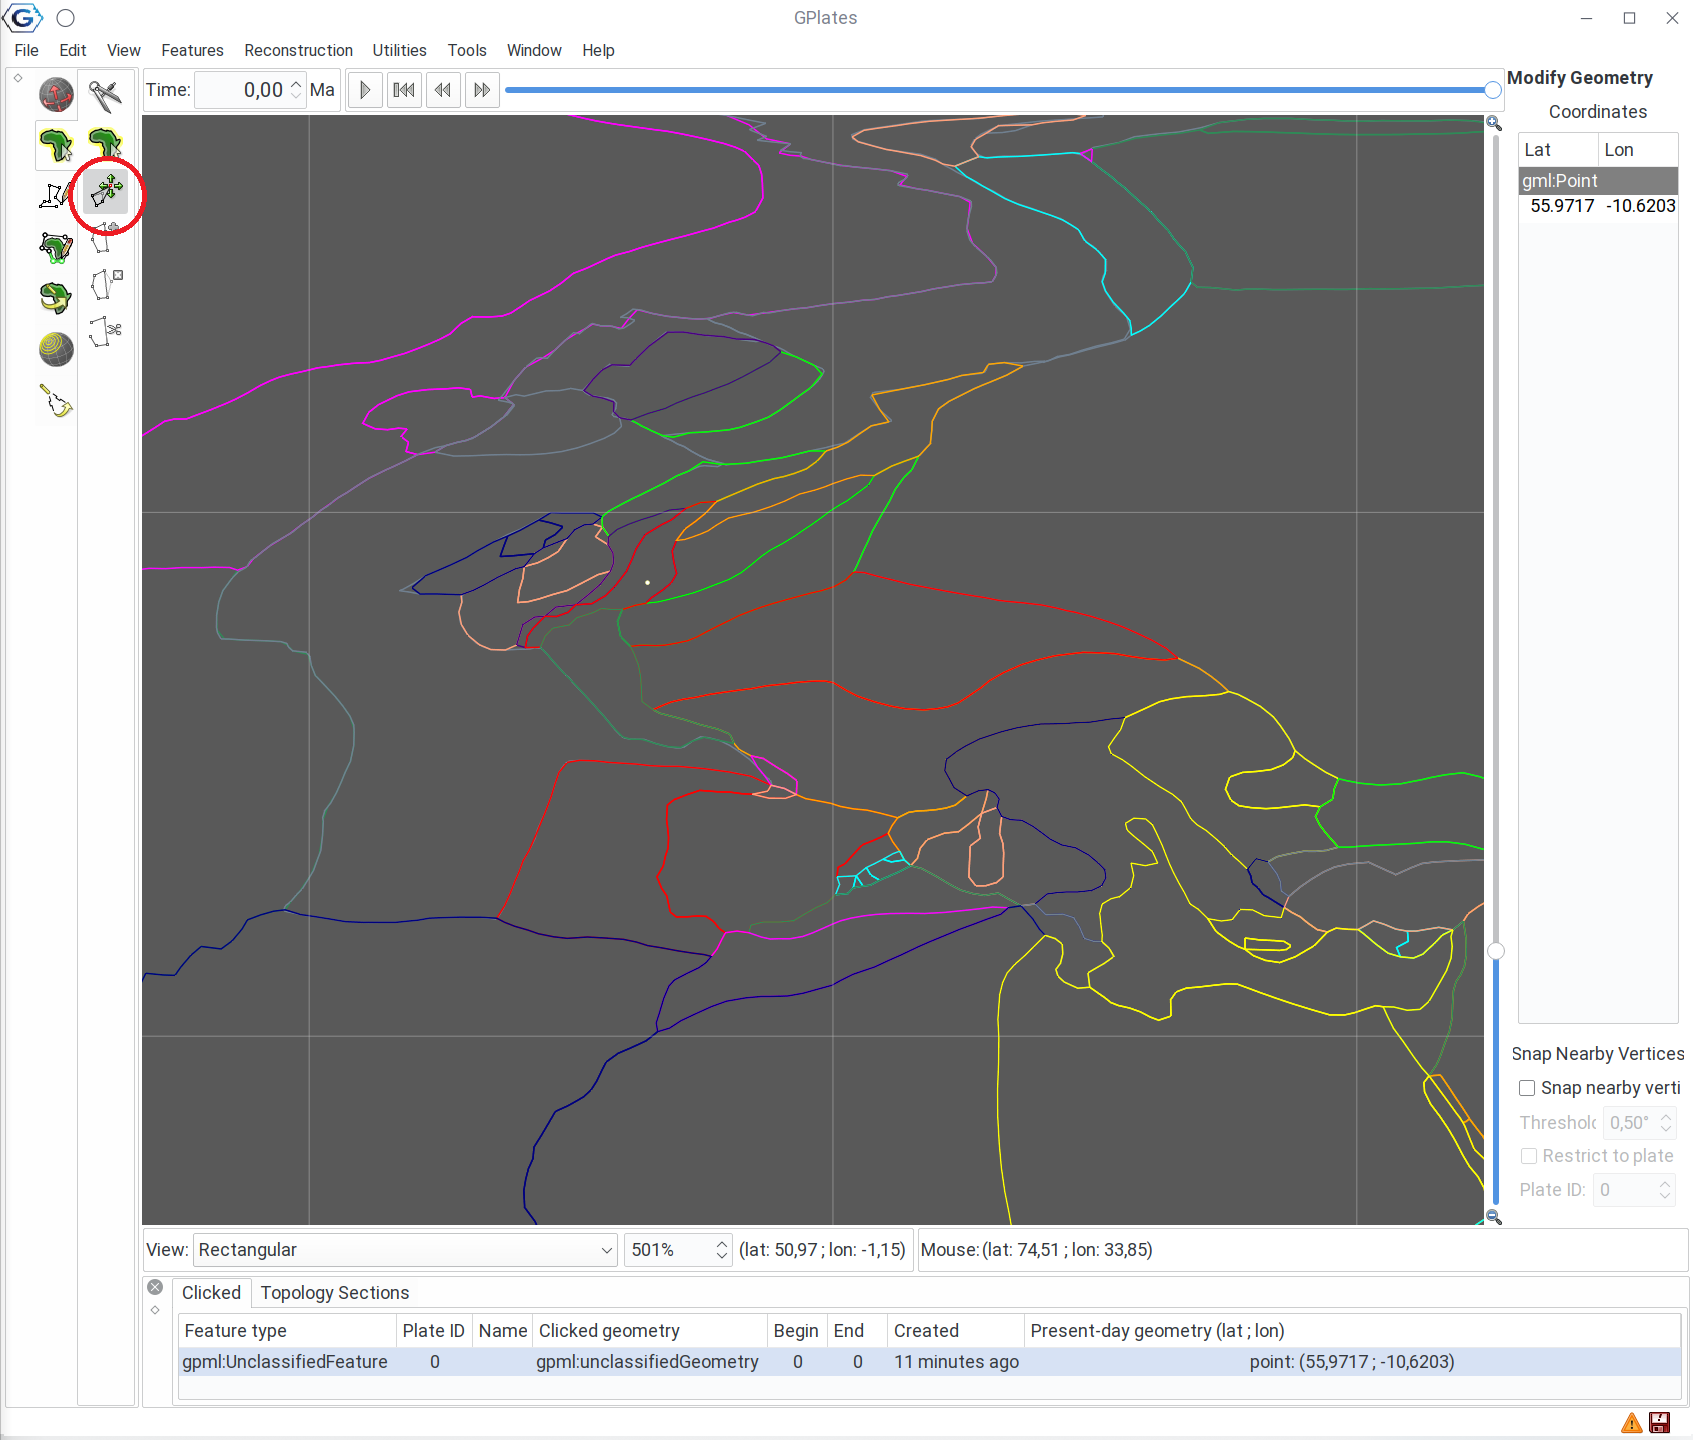
to move the point to its desired position (look at the right-hand pane).
You don’t need to confirm these changes, once you move the point, it will stay where you put it.
Now we have to find the Plate ID below the point. You can use the Inspect feature tool for this as well. Remember that the selected plate will be highlighted with white outlines.
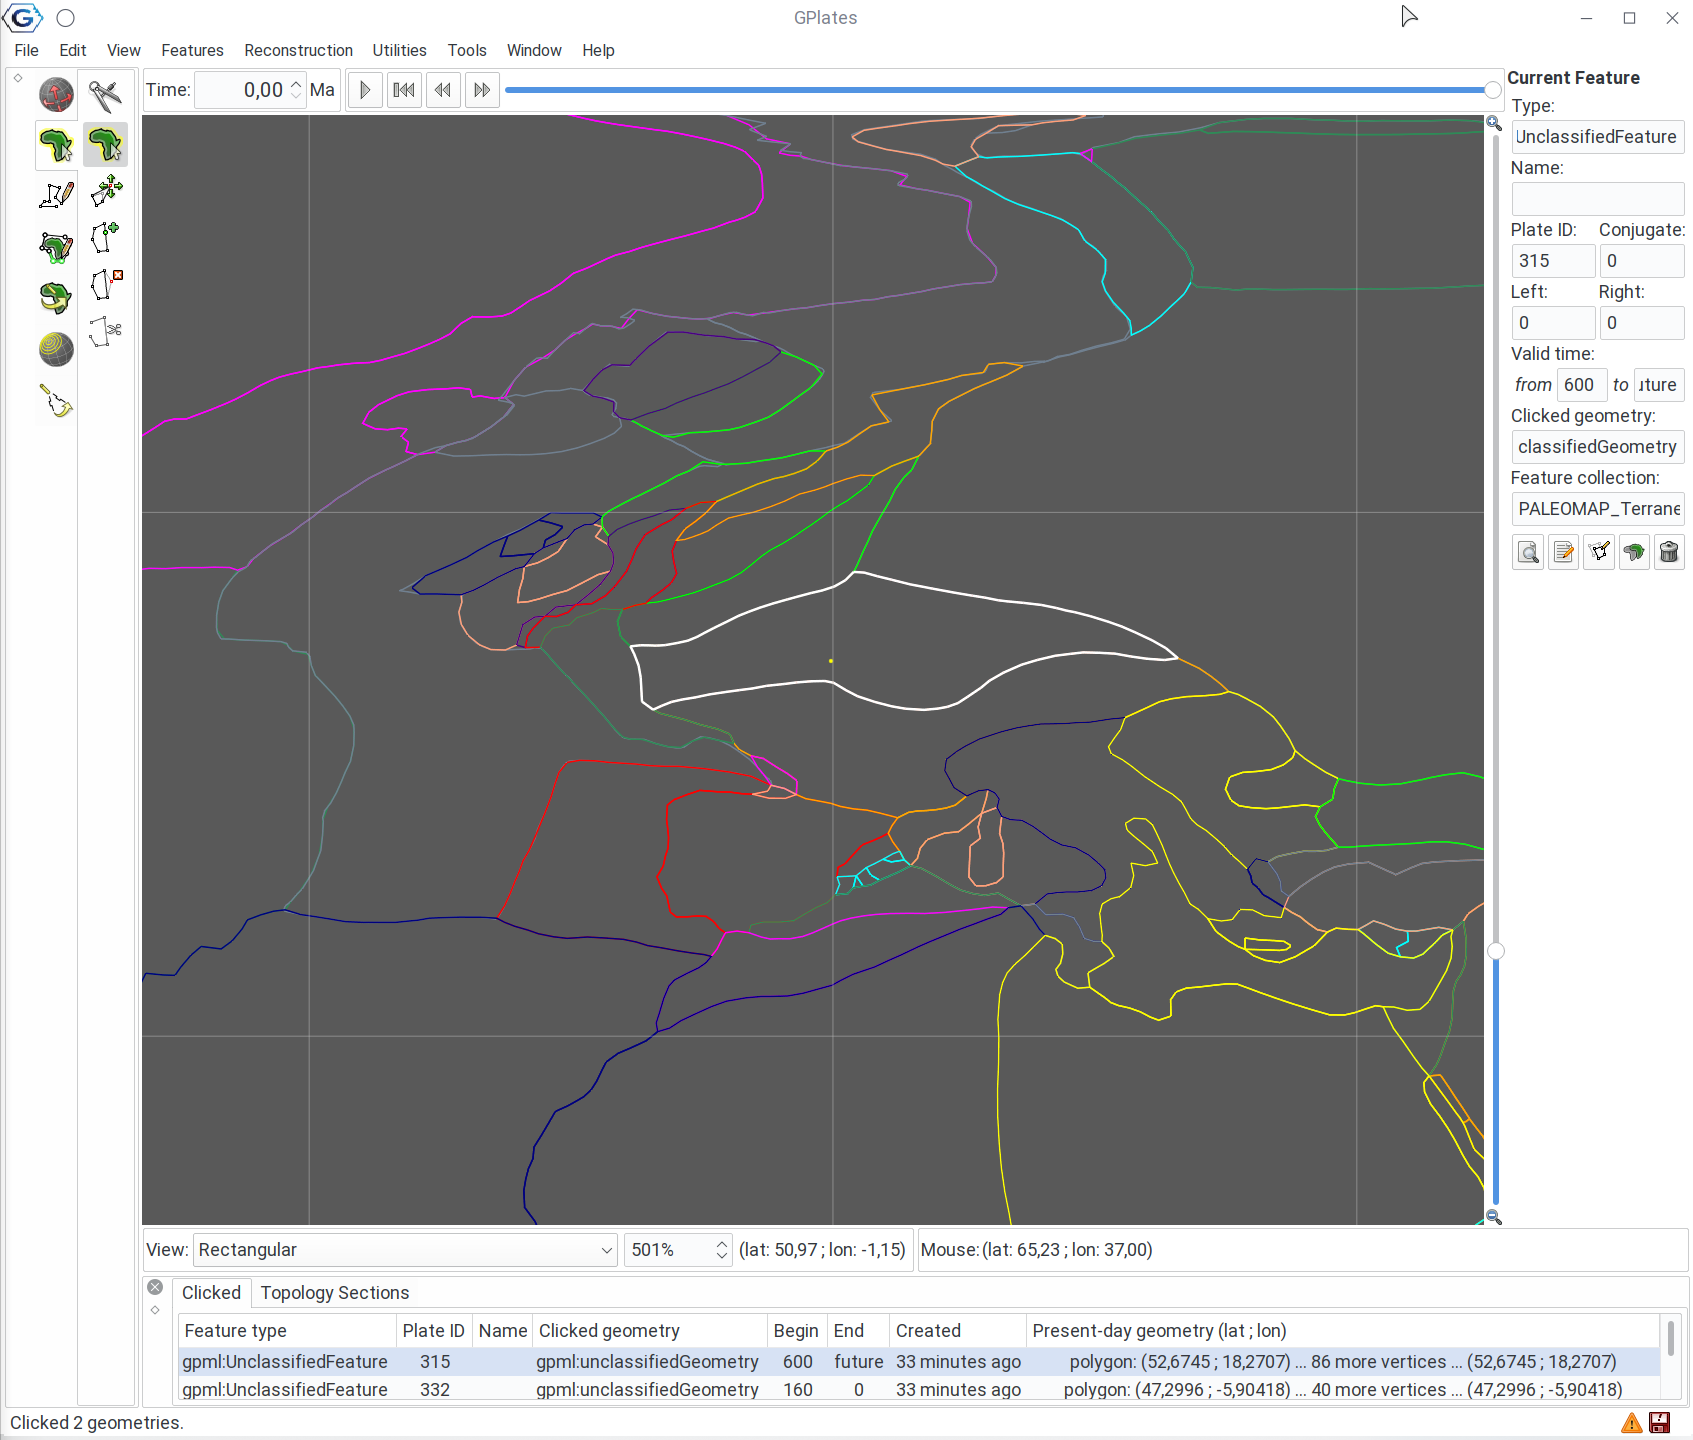
You can see on the right-hand site, that the ID of the plate is 315, and its valid time is from 600 to future.
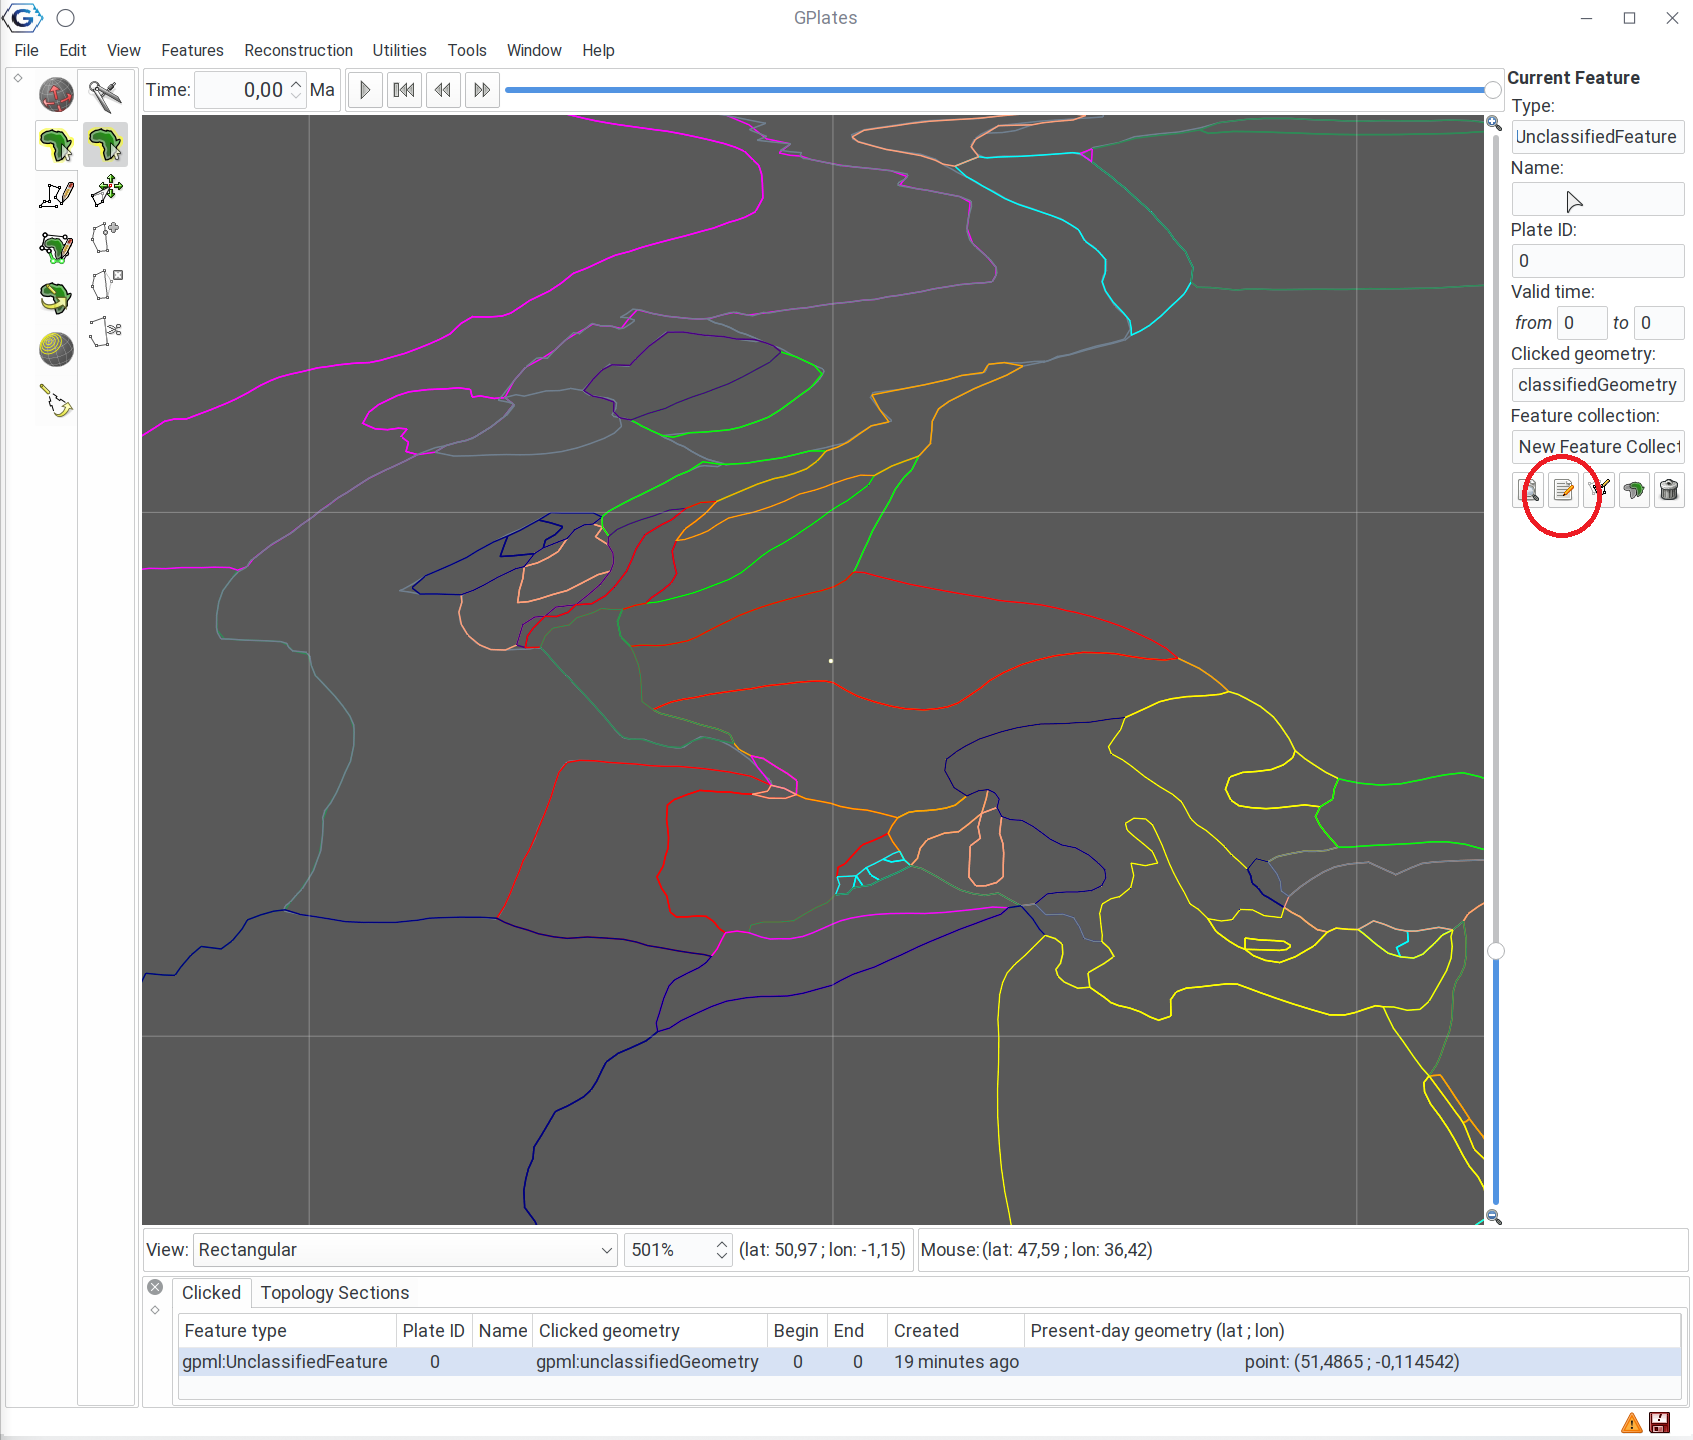
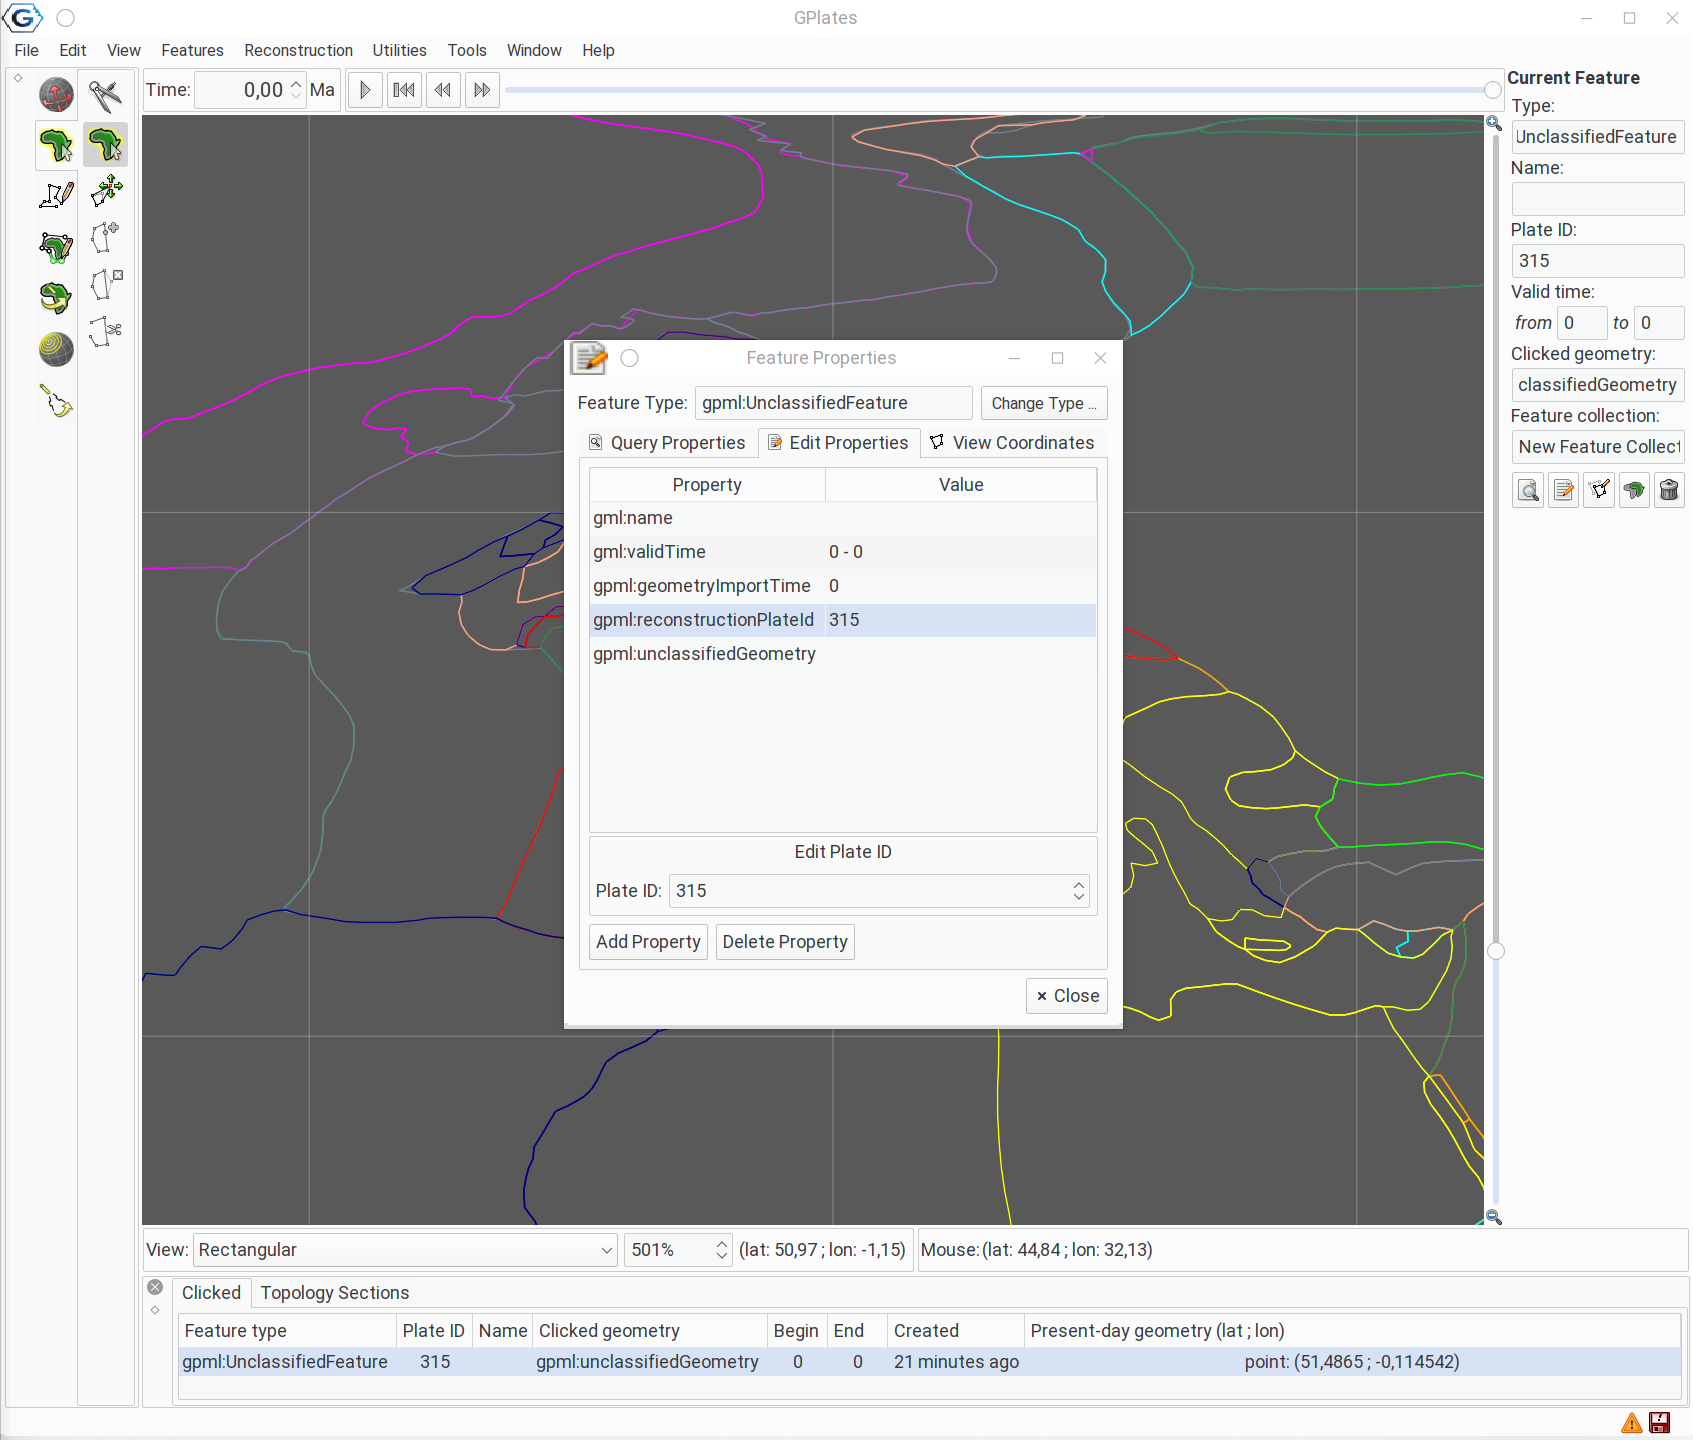
Use the Inspect feature tool to select the point again! Then click on the Edit Feature tool on the right-hand side (little piece of paper with the pencil on it):
This will open a window, where you can edit the properties of this feature. First, click on the line with gpml:reconstructionPlateId
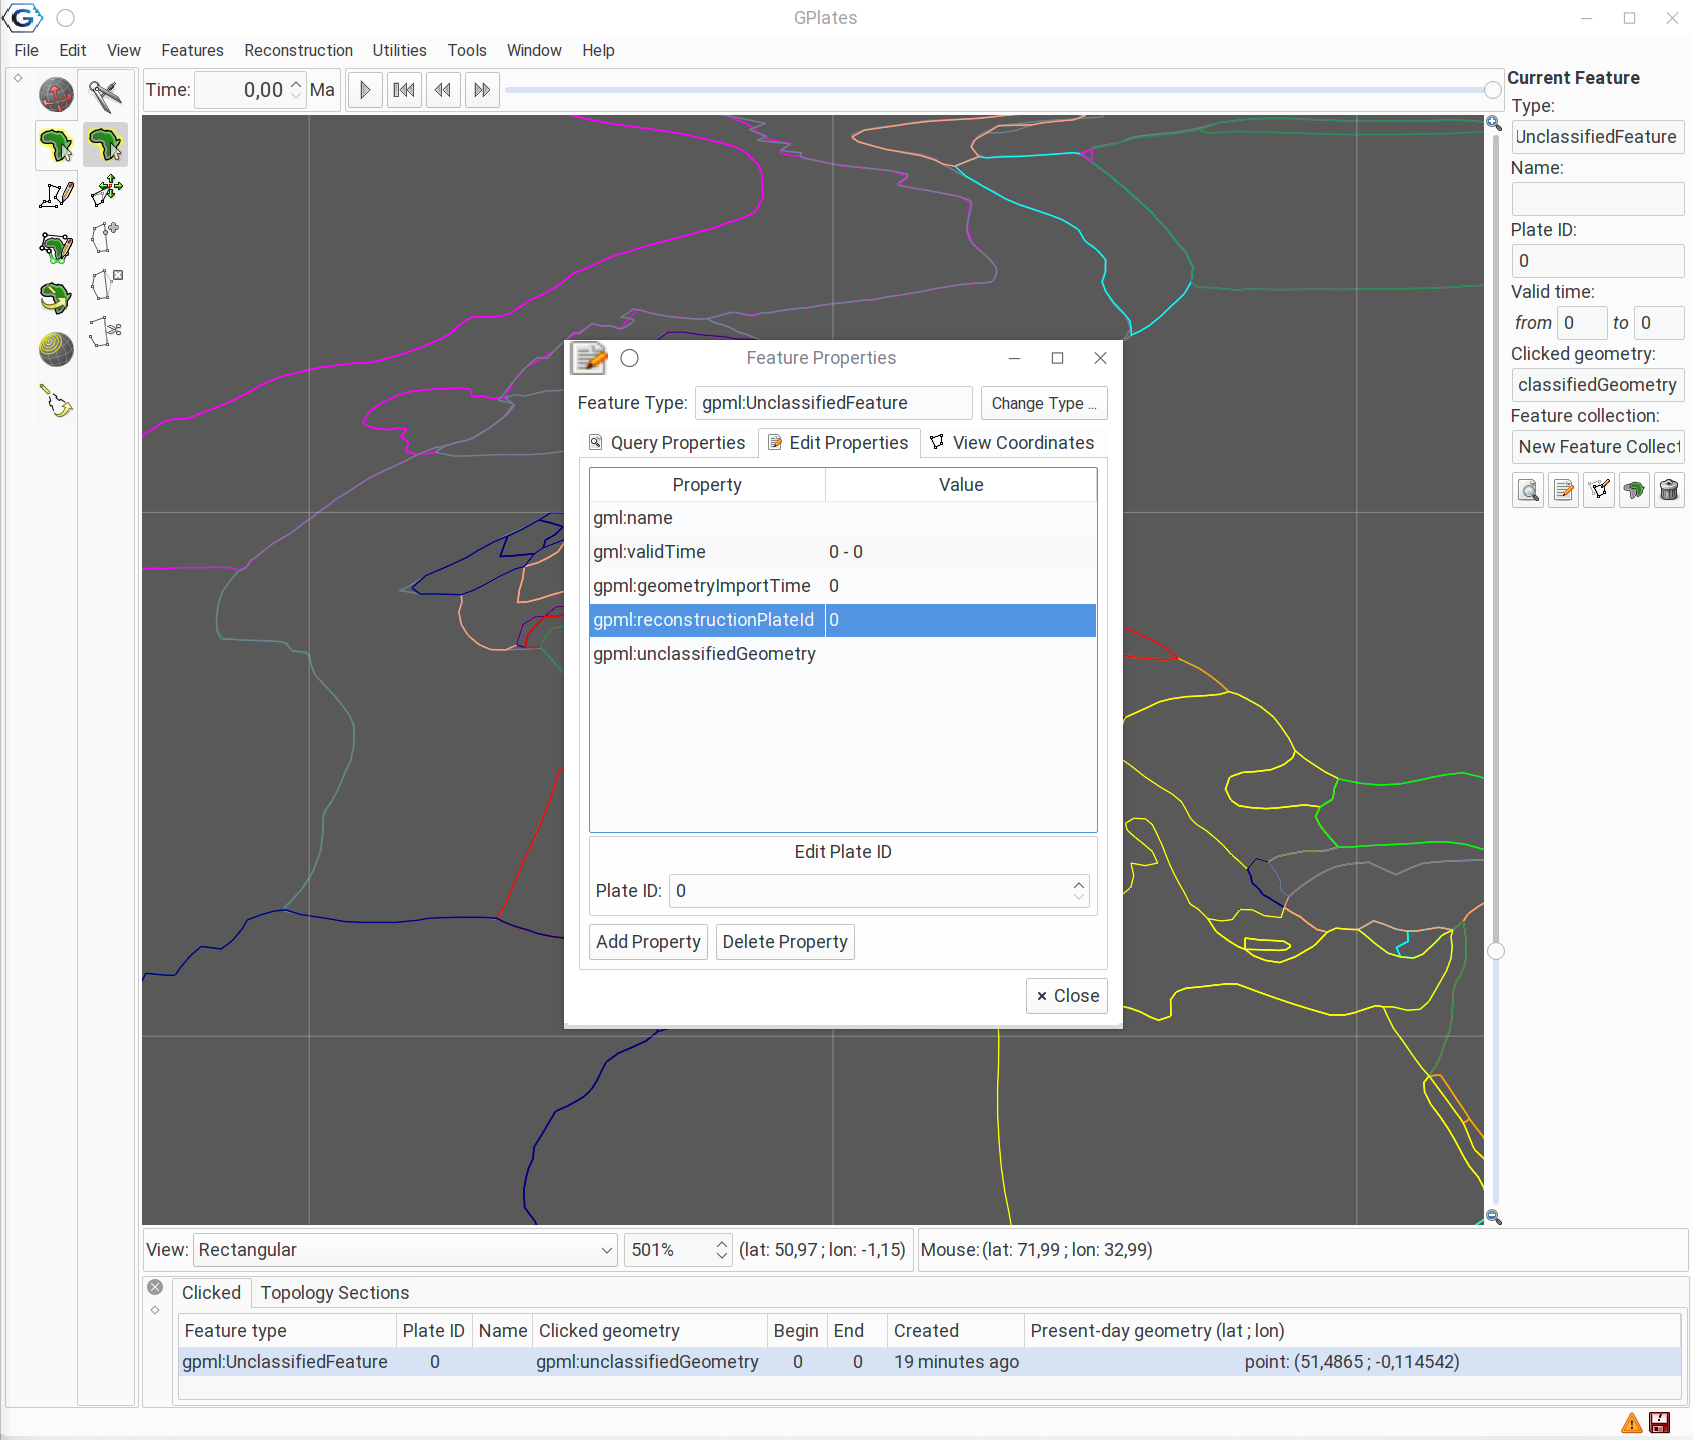
and enter 315 to the Plate ID field, and hit the Return/Enter key on the keyboard. Then you will see that the table is updated:
Then repeat the process for the gpml:validTime row! Set the Begin to 600Ma, and the end, to Distant Future!
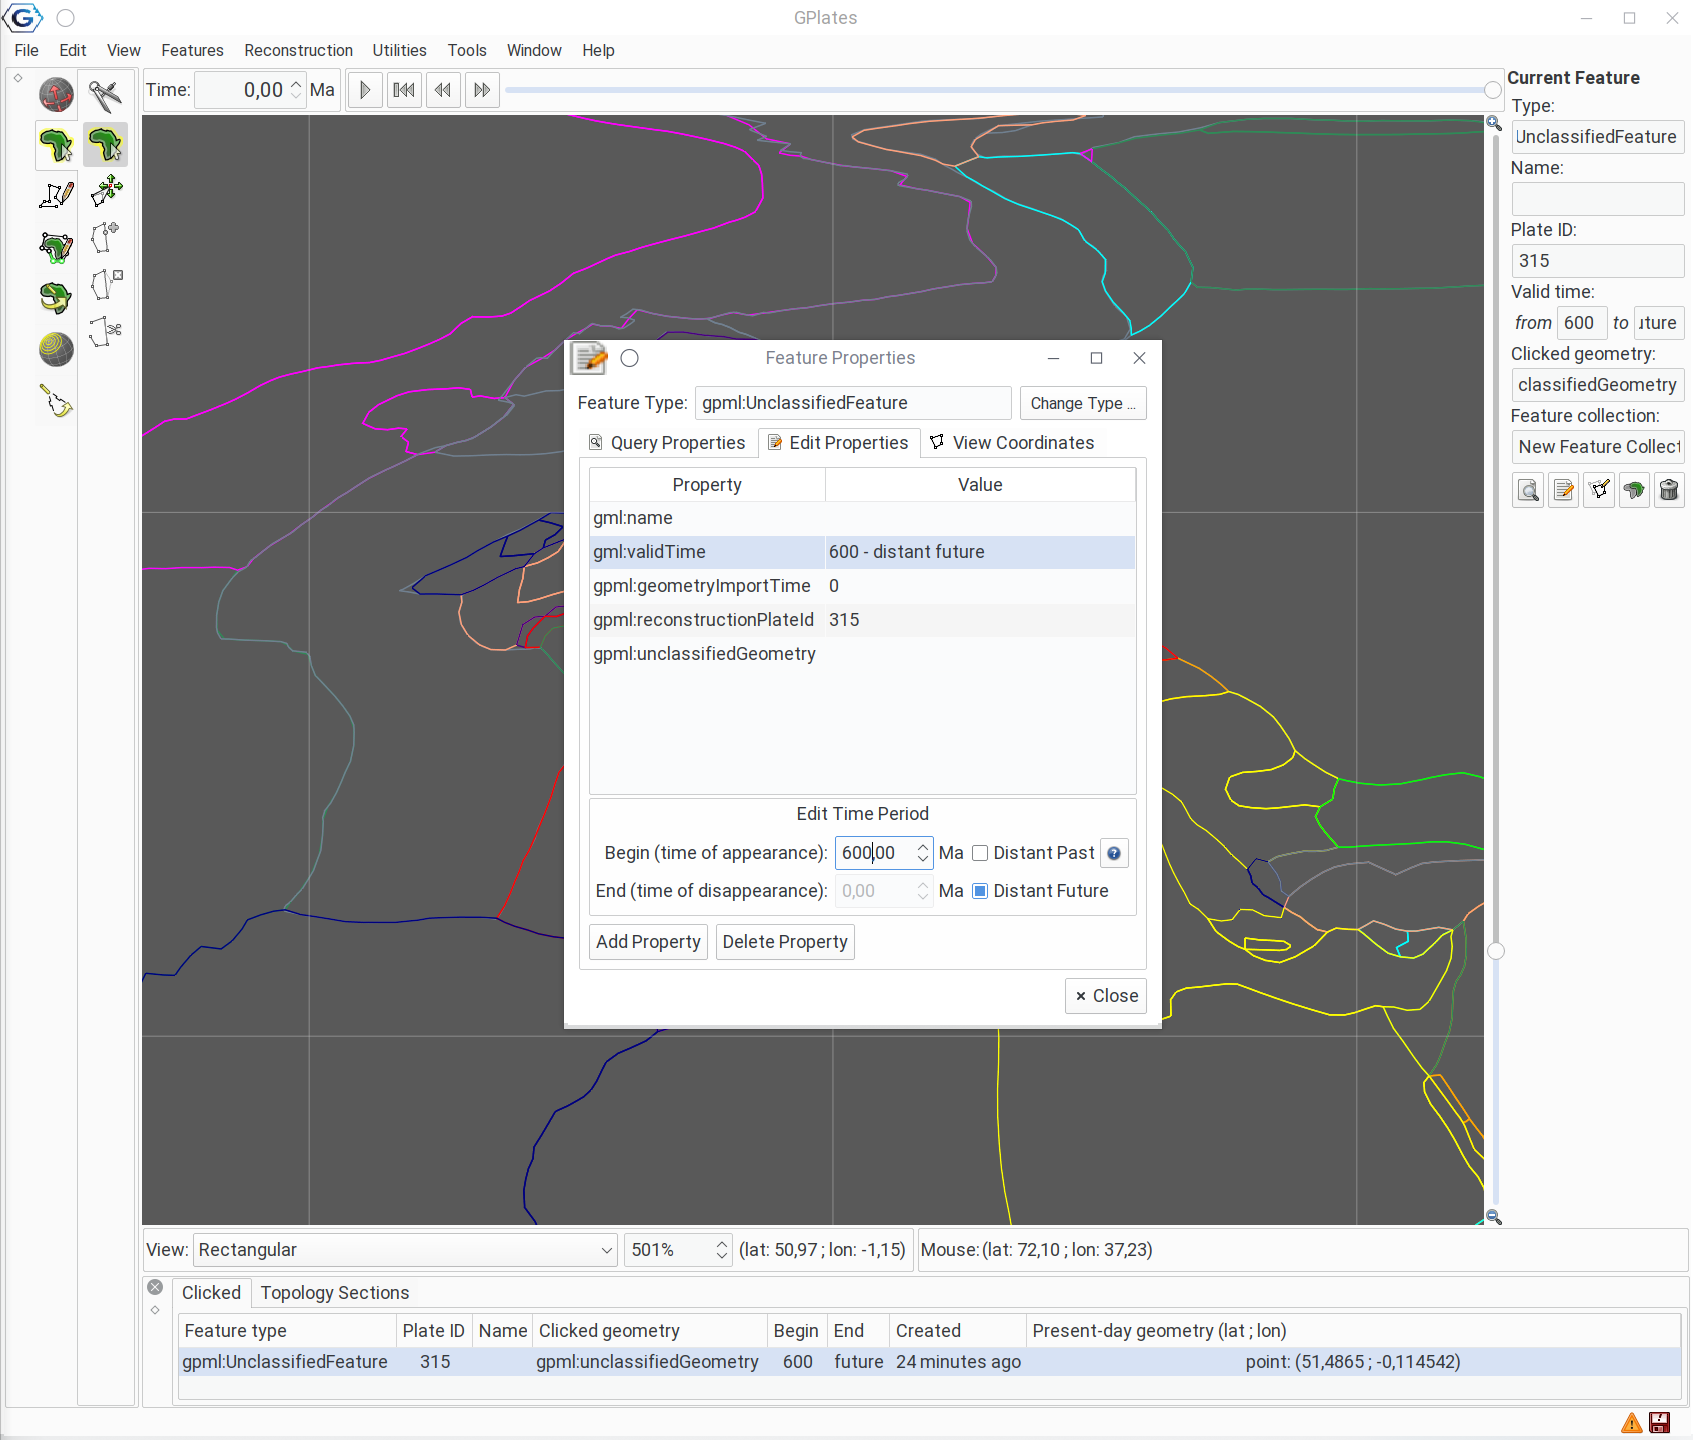
Then you can click on Close!
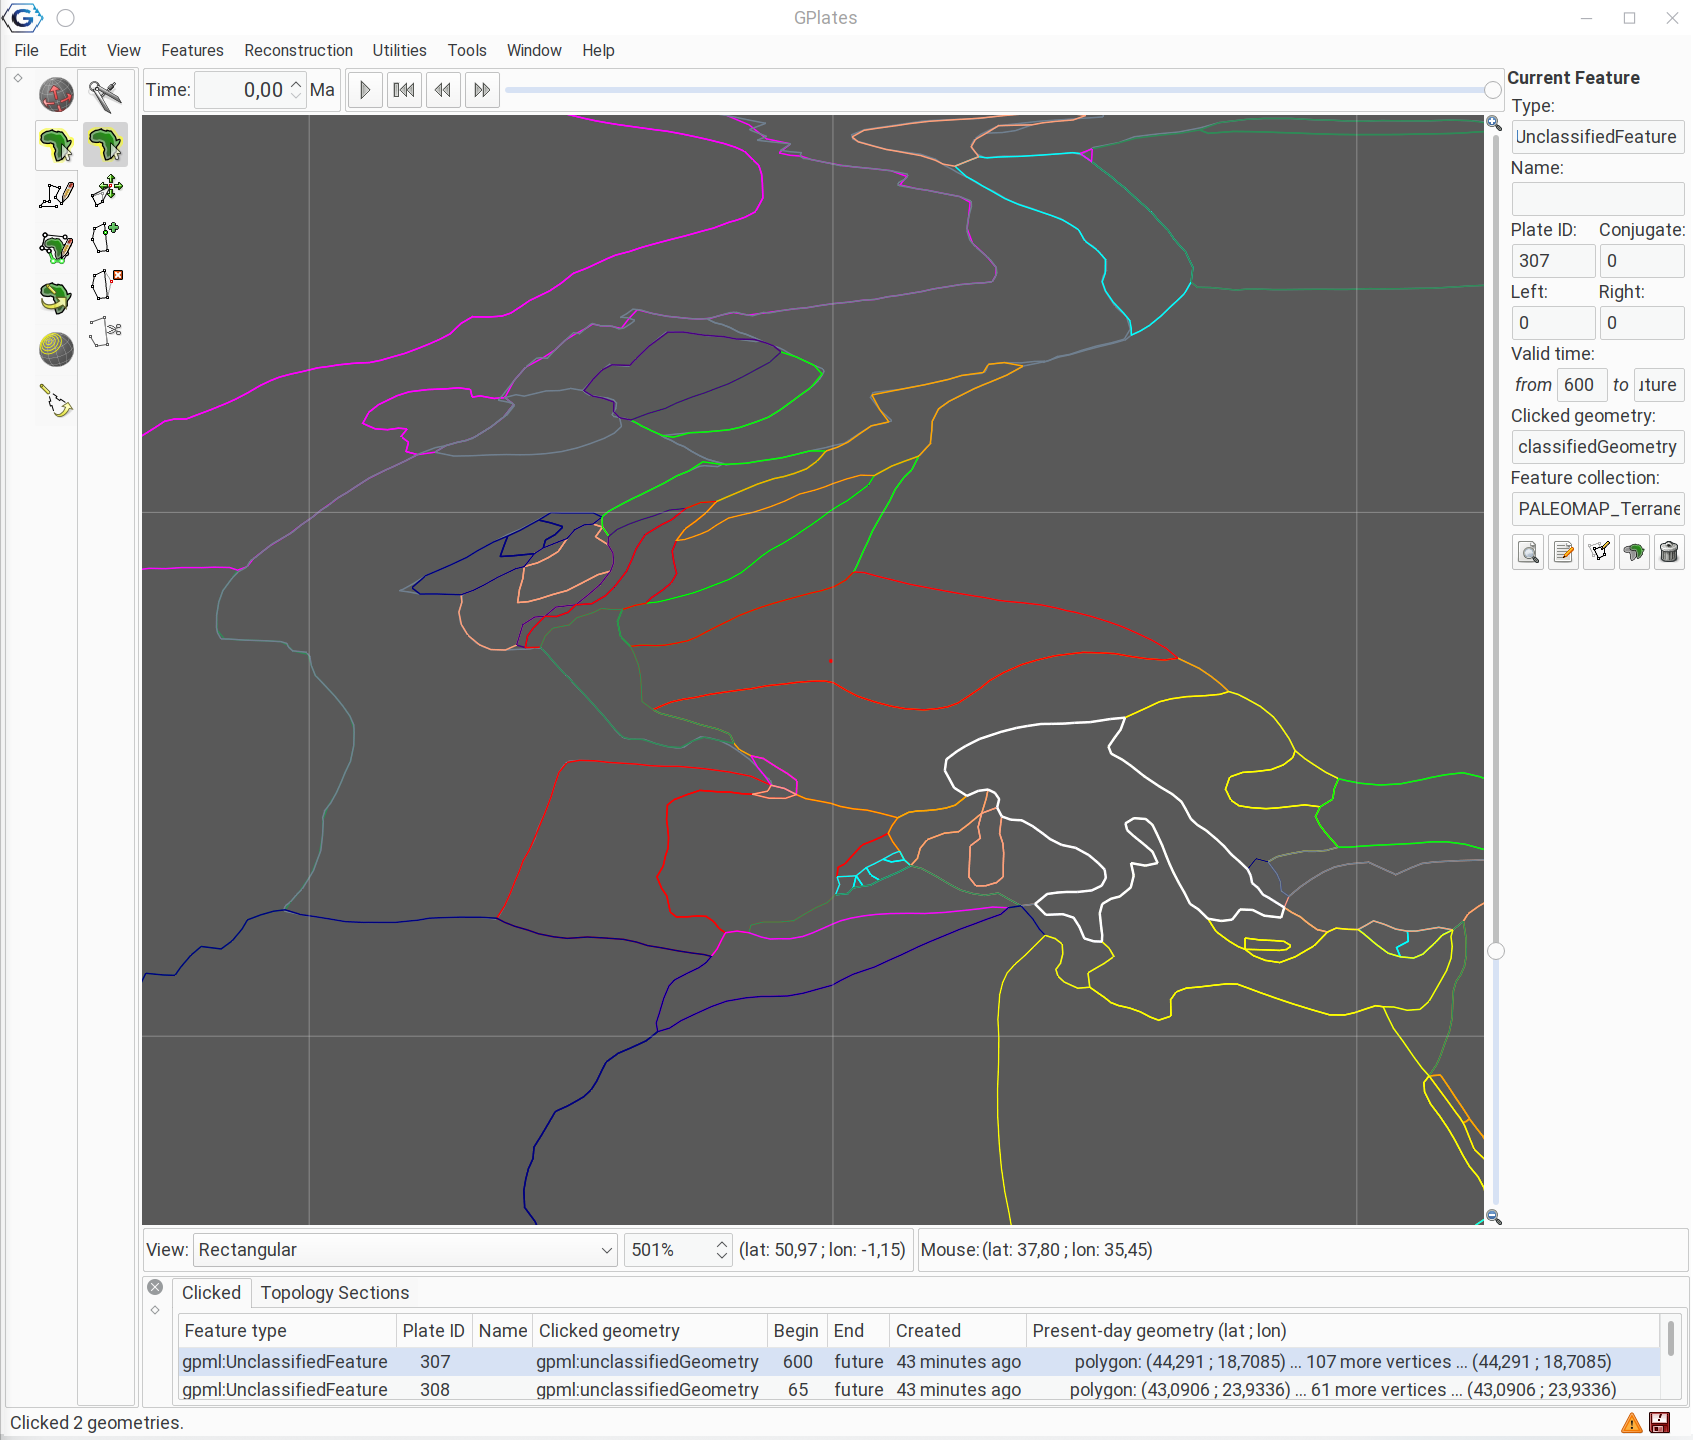
If you use the Inspect feature tool to select another feature (not the point of London), then you will see that the point has now changed color: it has the same color as the underlying plate:
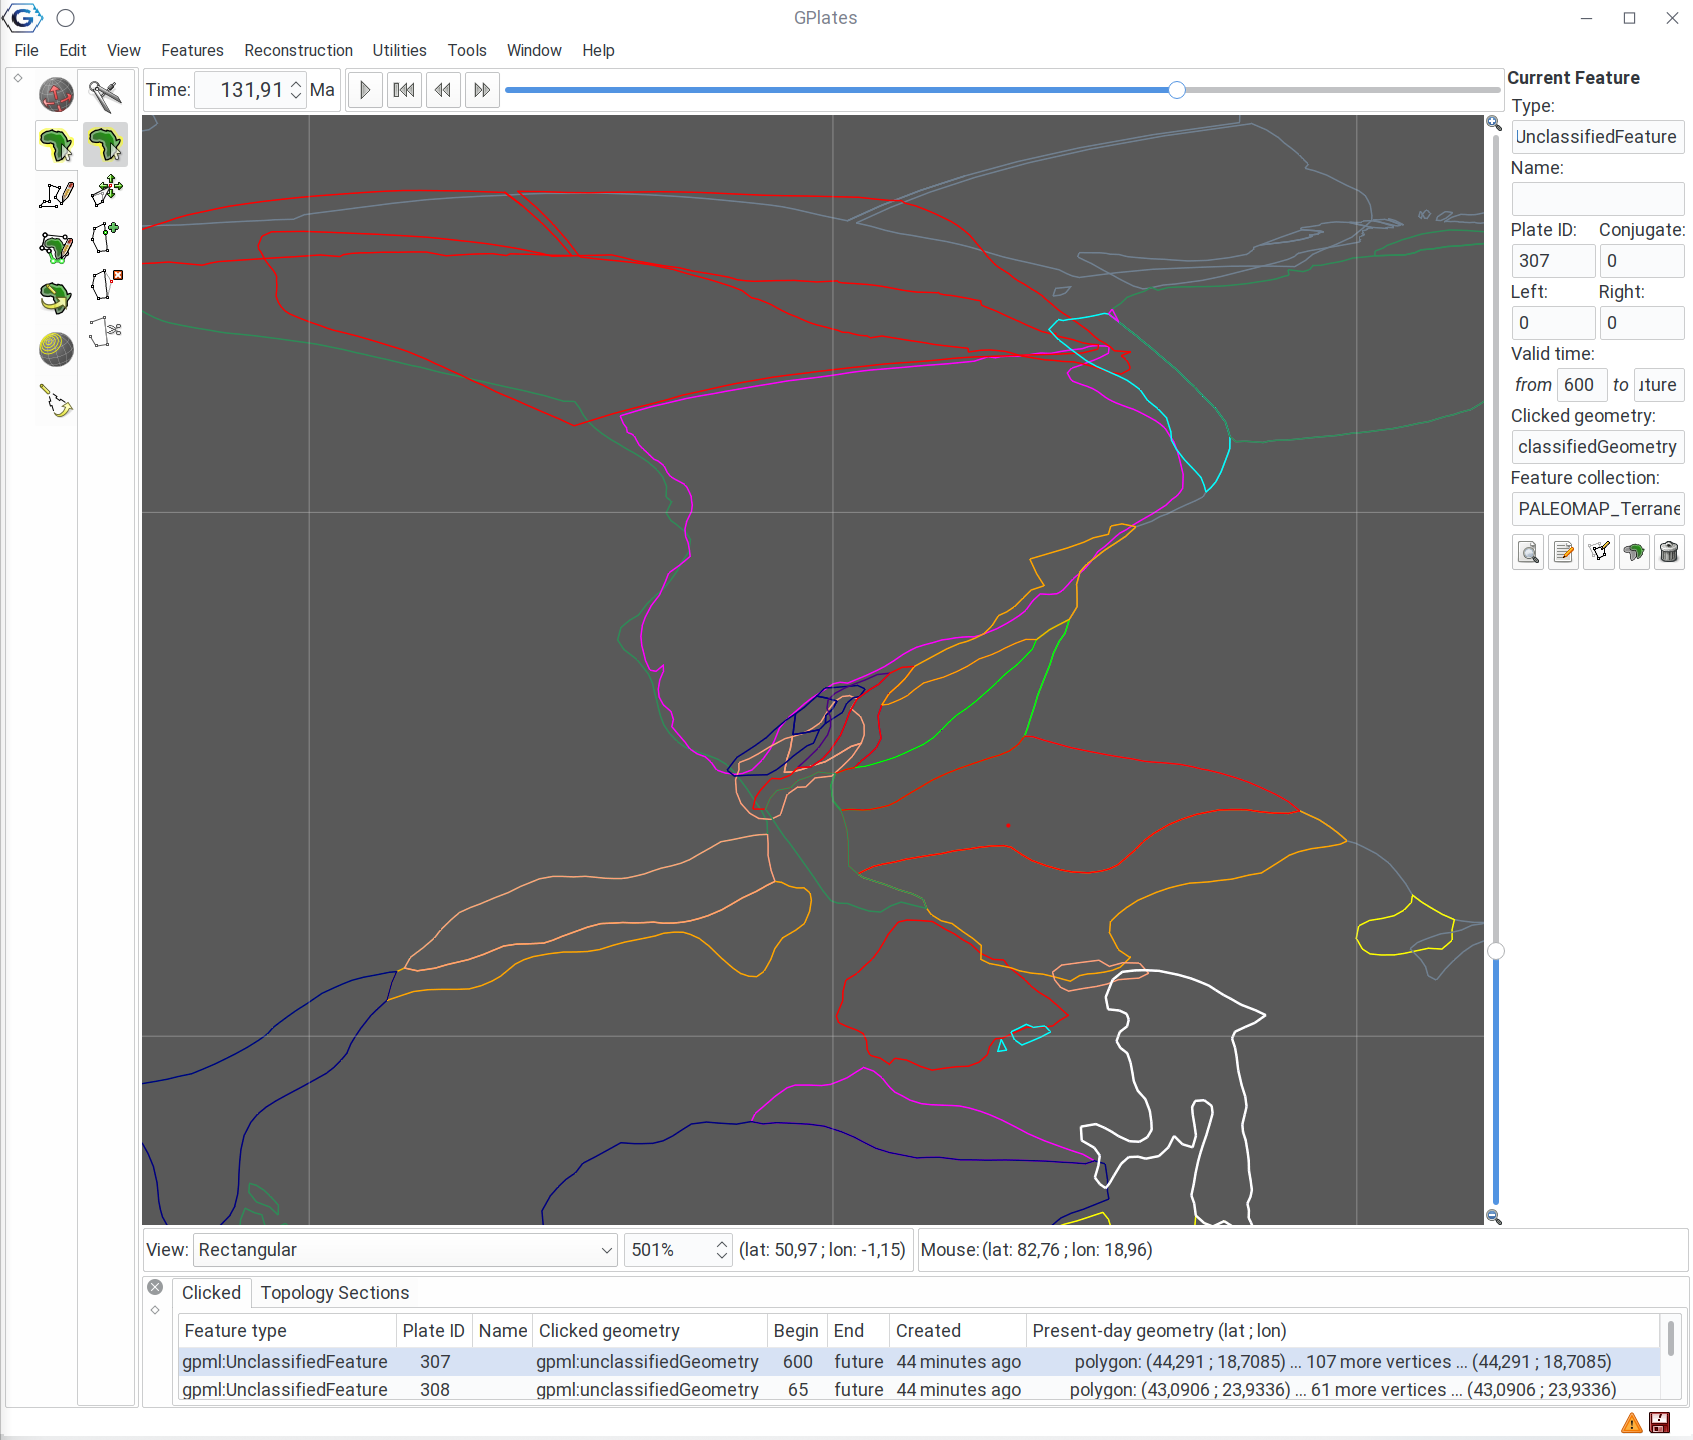
Now the point will move with plates, and you can trace how it moves over time:
The kinematics tool
GPlates have a built-in tool to analyzed how feature have moved in time. To use this, select the point again, with the Inspect feature tool, and go to the Utiliites / Open Kinematics Tool:
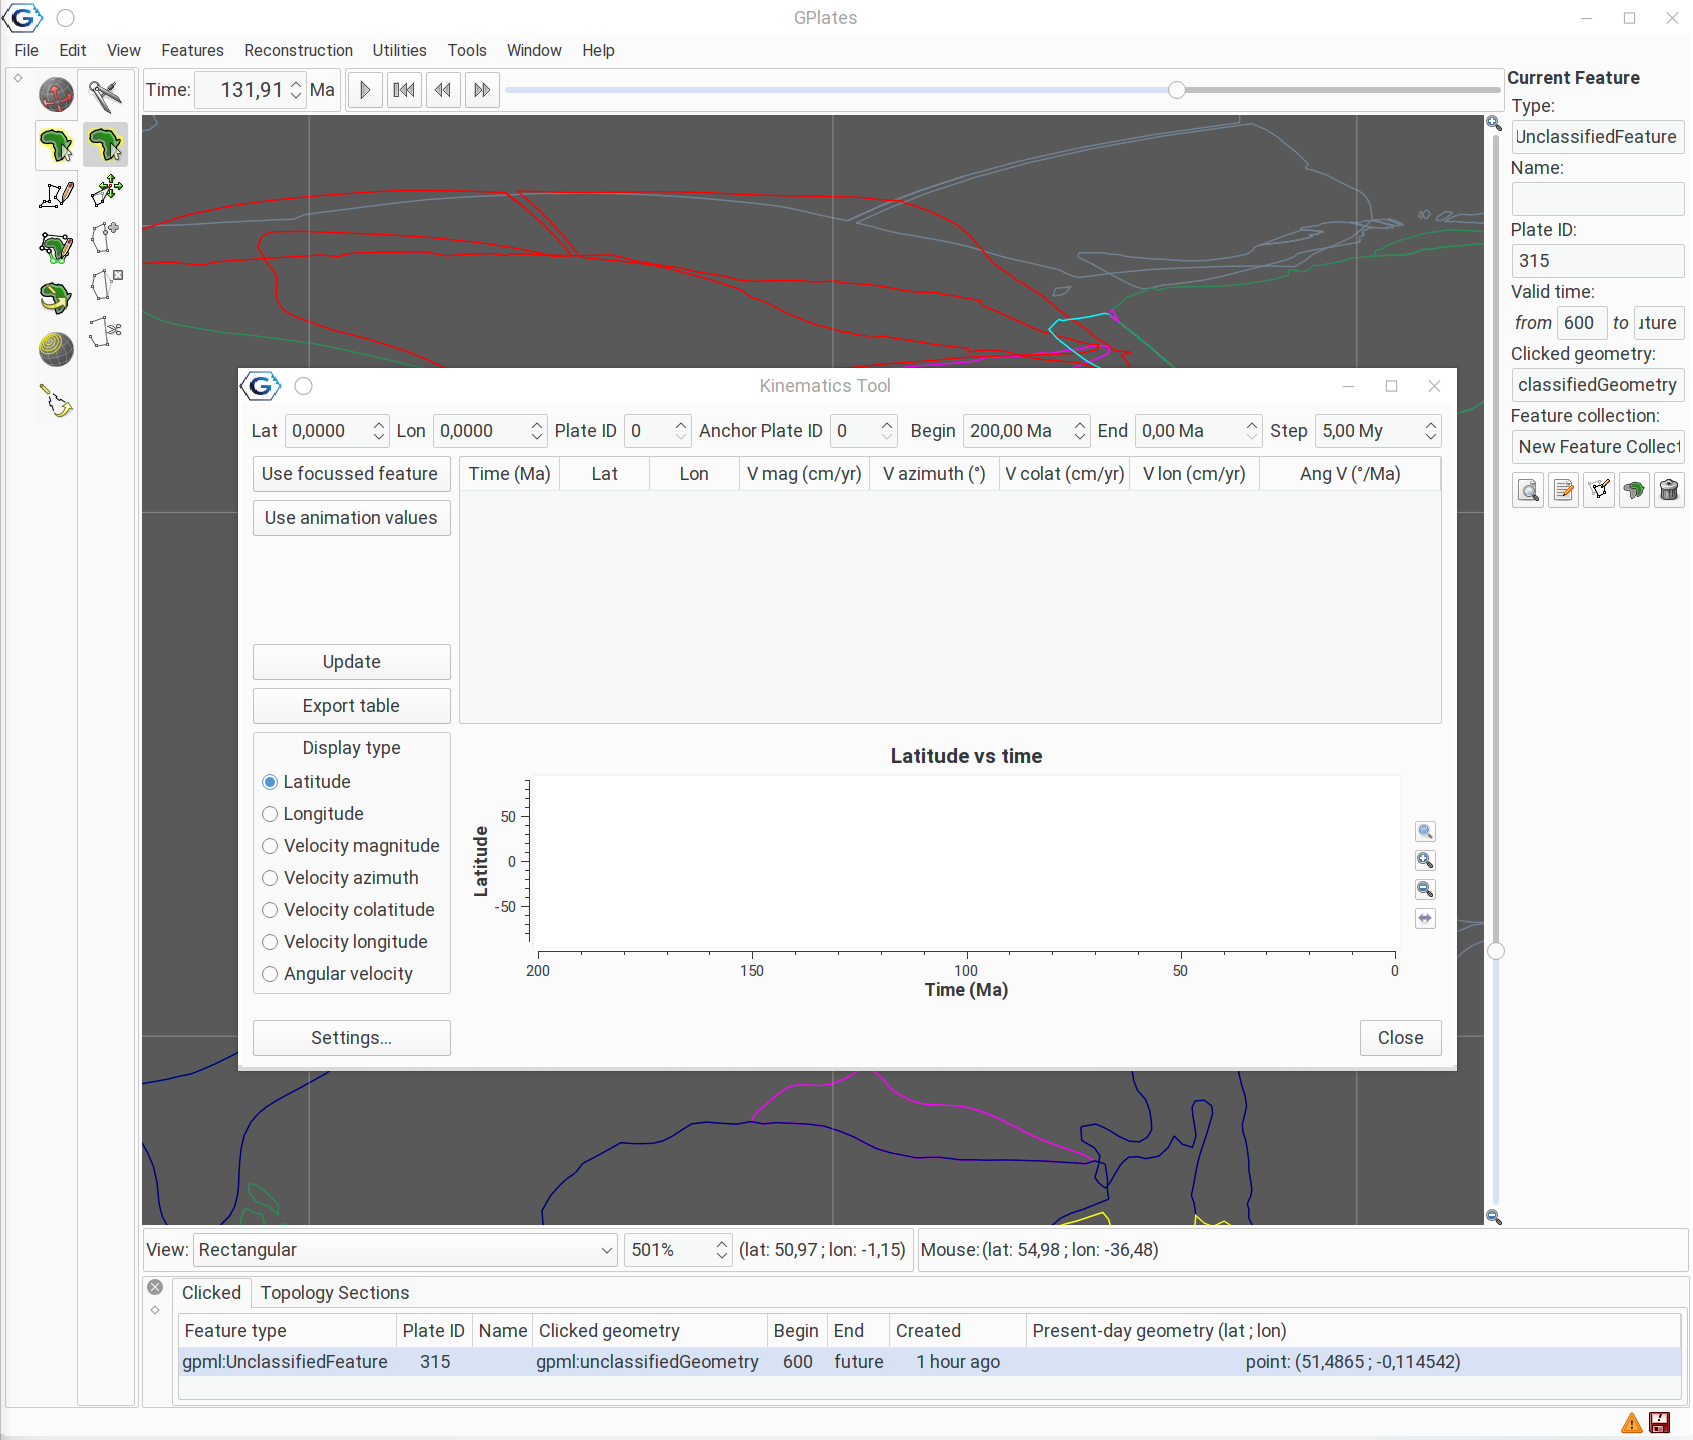
Click on the Use focussed feature button!
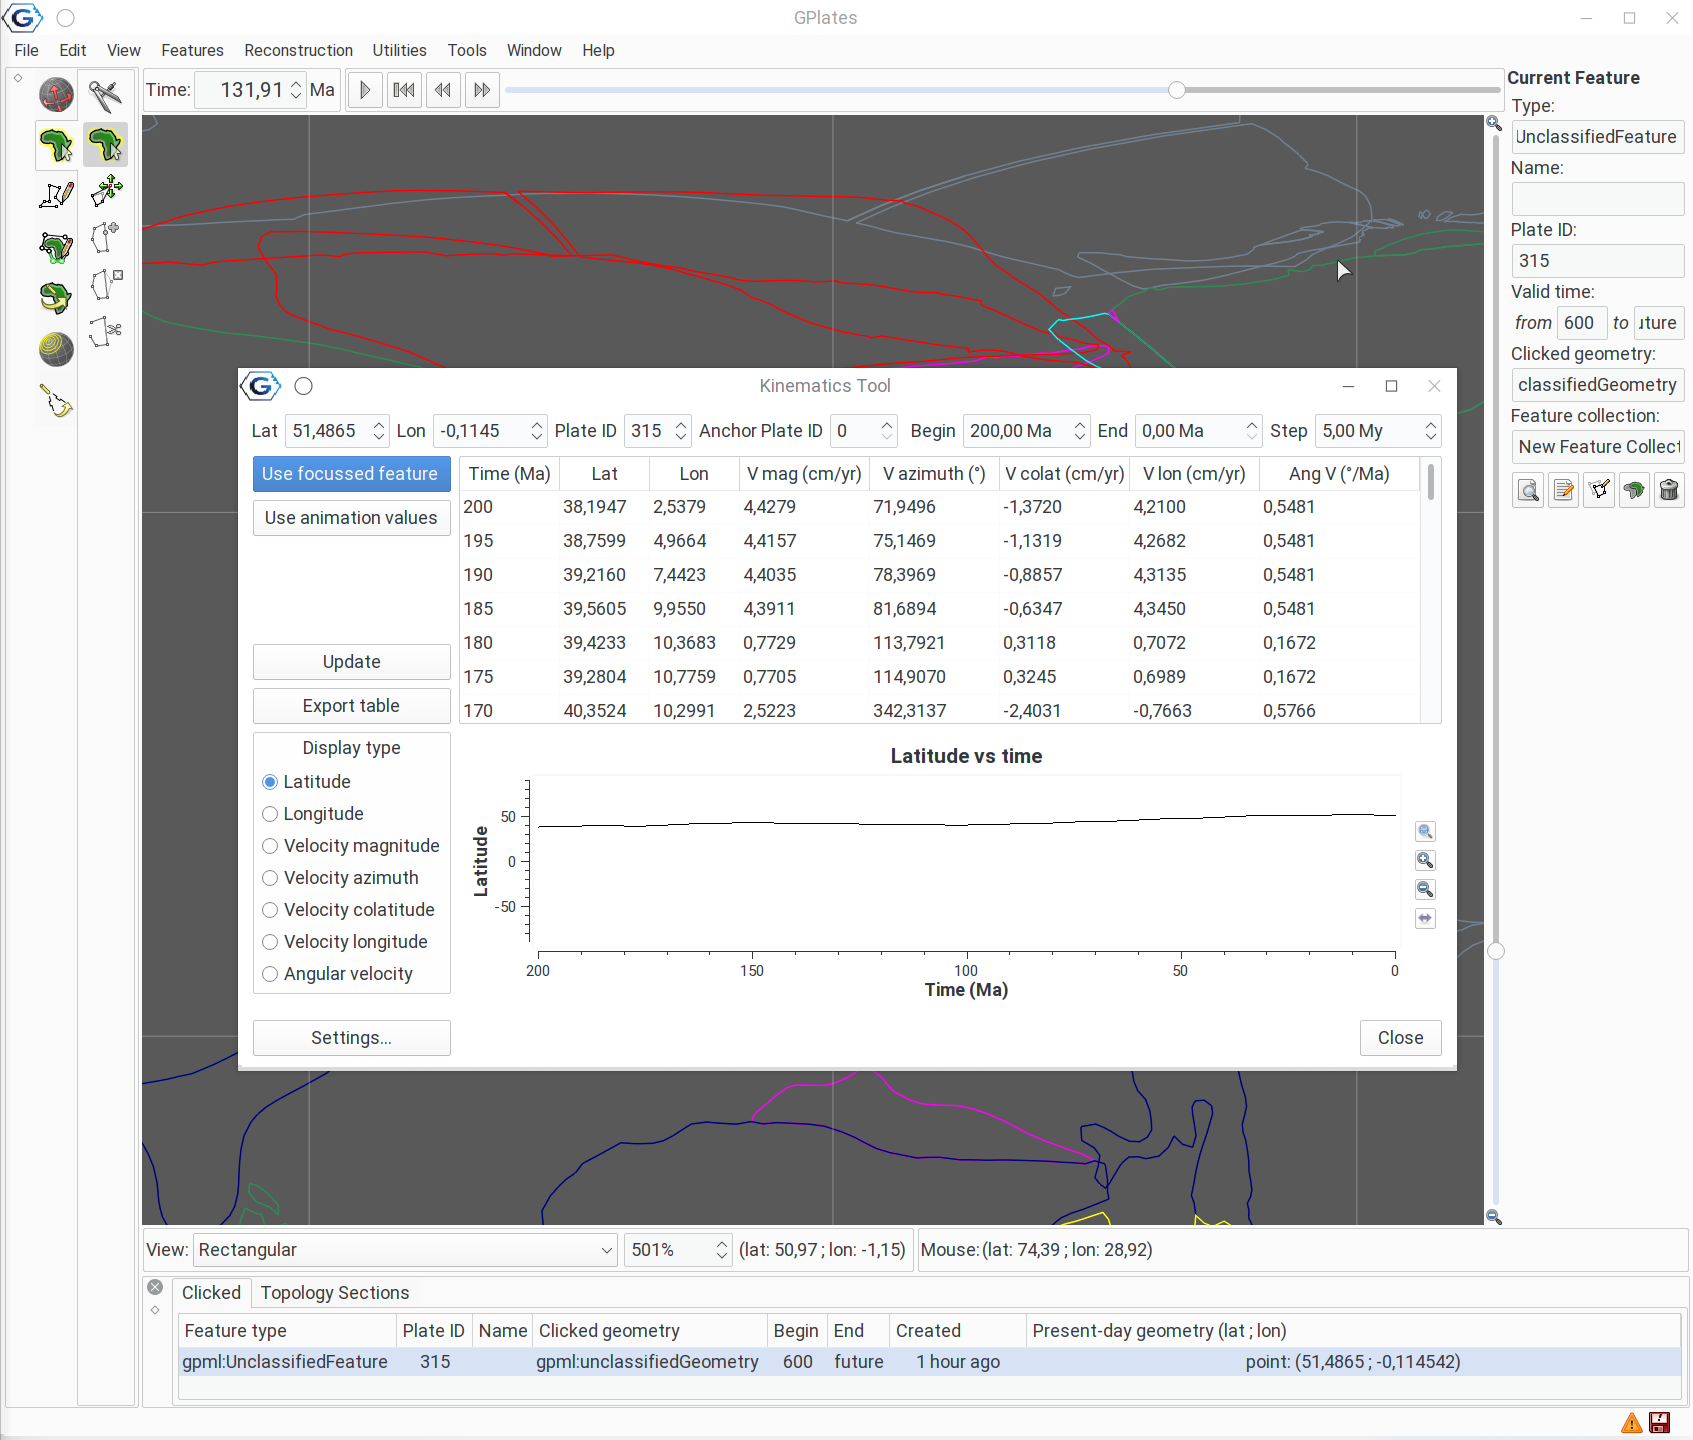
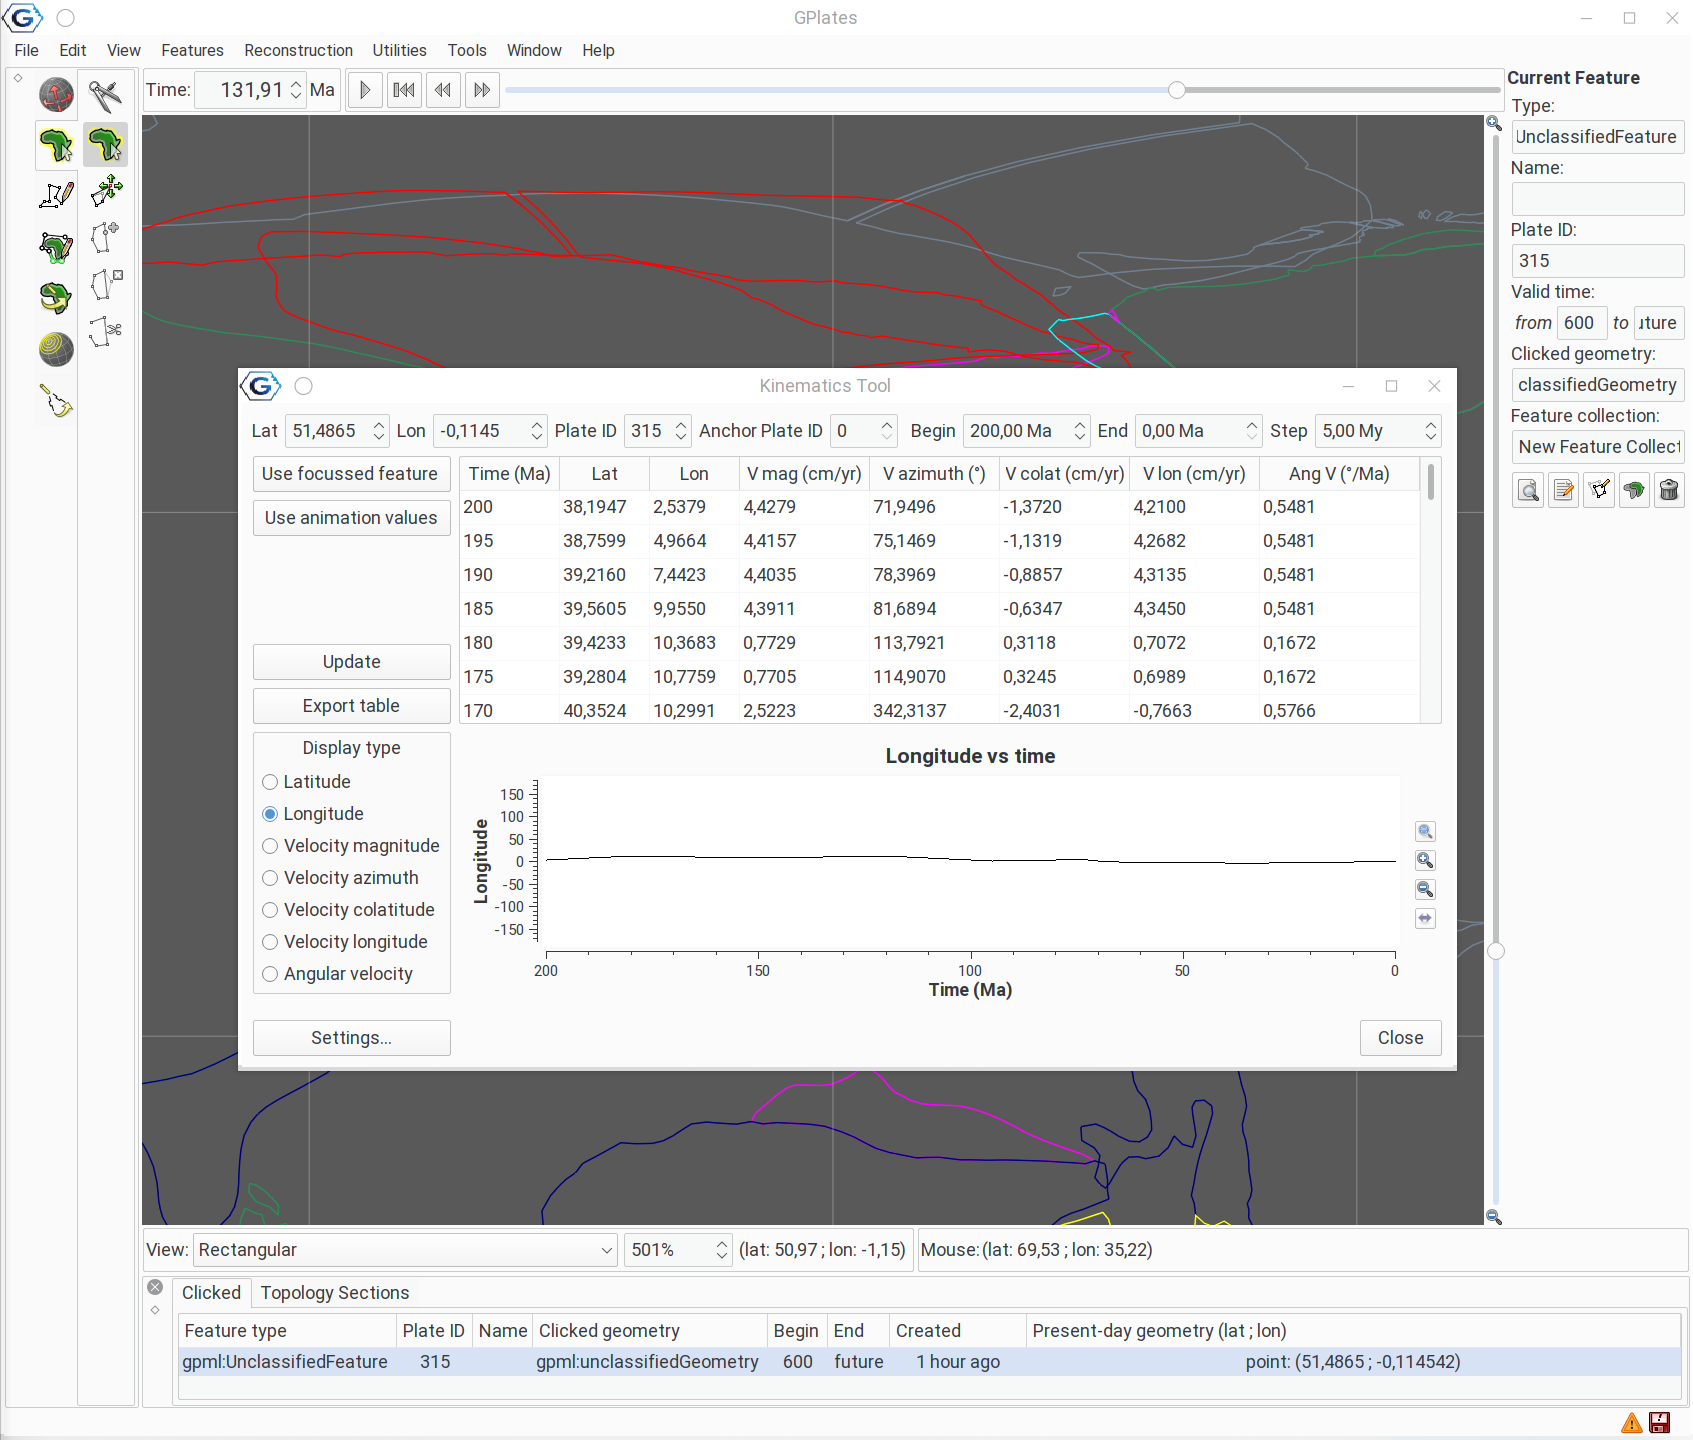
The tool now displays data on the latitude, longitude, and velocity information of the point, depending on what you select, for instance longitude, which barely changed over time in the displayed interval:
Here you can look at the following:
- Latitude: the latitude of the feature as a function of time
- Longitude: the longtidue of the feature as a function of time
- Velocity magnitude: the total velocity of the feature in cm/year
- Velocity azimuth: the azimuth of the velocity vector (direction in degrees)
- Velocity colatitude: the latitudinal component of the velocity vector in cm/year
- Velocity longitude: the longitudinal component of the velocity vector in cm/year
- Angular velocity: the total rotation of the feature, in degree/Ma
You can also select the display interval for the calculated interval at the top, for instance to display Phanerozoic scale data (540-0Ma). Note that the plot will not be updated until you hit the Update button:
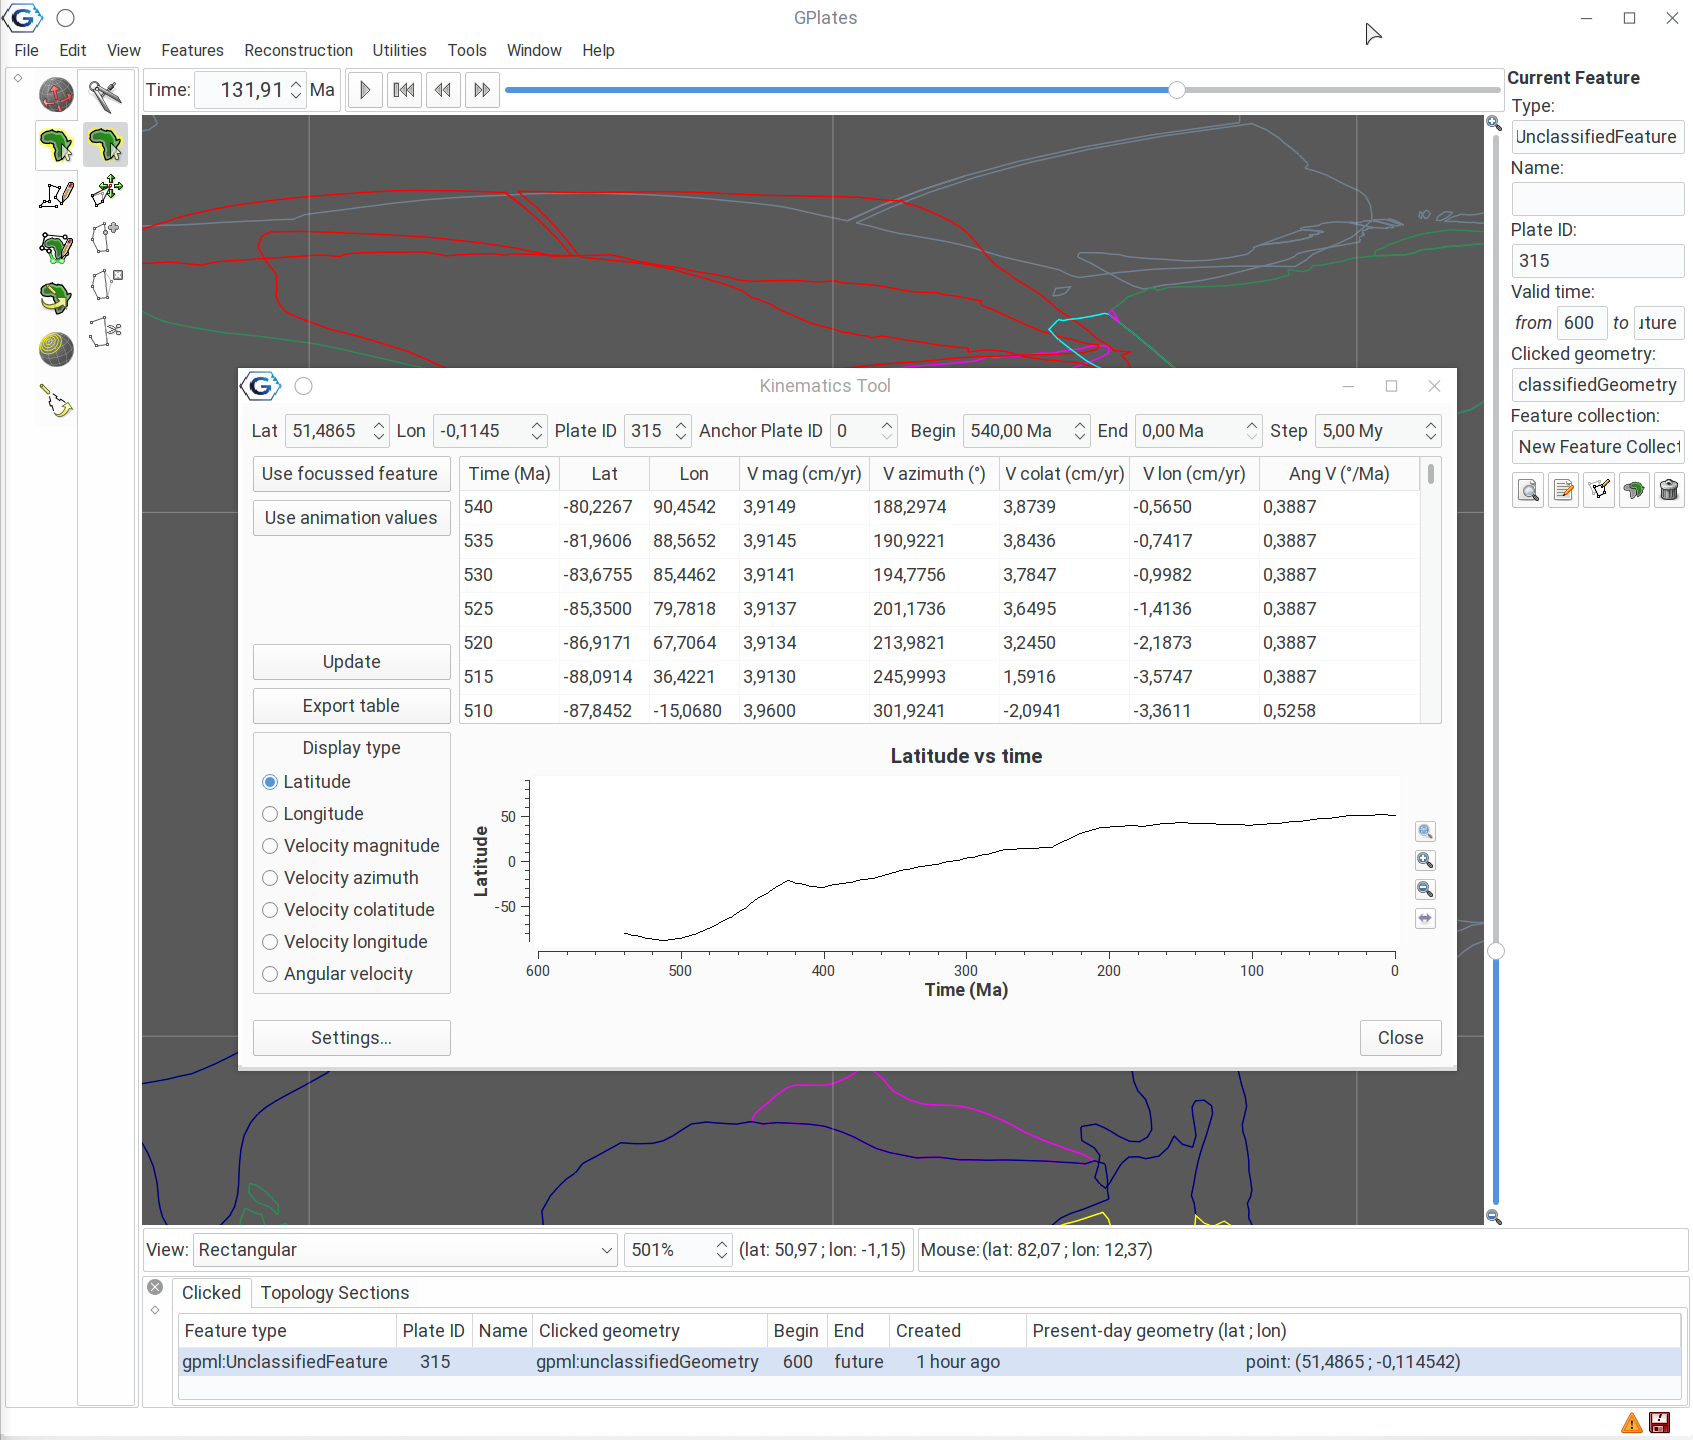
This curve suggests that London has been gradually drifing northwards through the Phanerozoic. You can also export data from this window if you click on the Export table button.